Pressure sensor CPT2500 with USB adapter CPA2500 and USBsoft
WIKA Operating Instructions, model CPT2500
12
5.5 Print Data
The respectively selected window
(data or diagram) can be printed via
„File – Print‟. Precondition is that a
printer has been installed to your
computer. Use „File – Printer Setup‟
to change printer parameters or to
choose another printer.
Under „Pictures“ additionally header
or footer pictures can be integrated to
the printouts.
The pictures or other templates have
to be saved as .bmp, .jpg or .icon
format (By this feature picture size
must matched before). The printout
can be extended to an individual form by simple means.
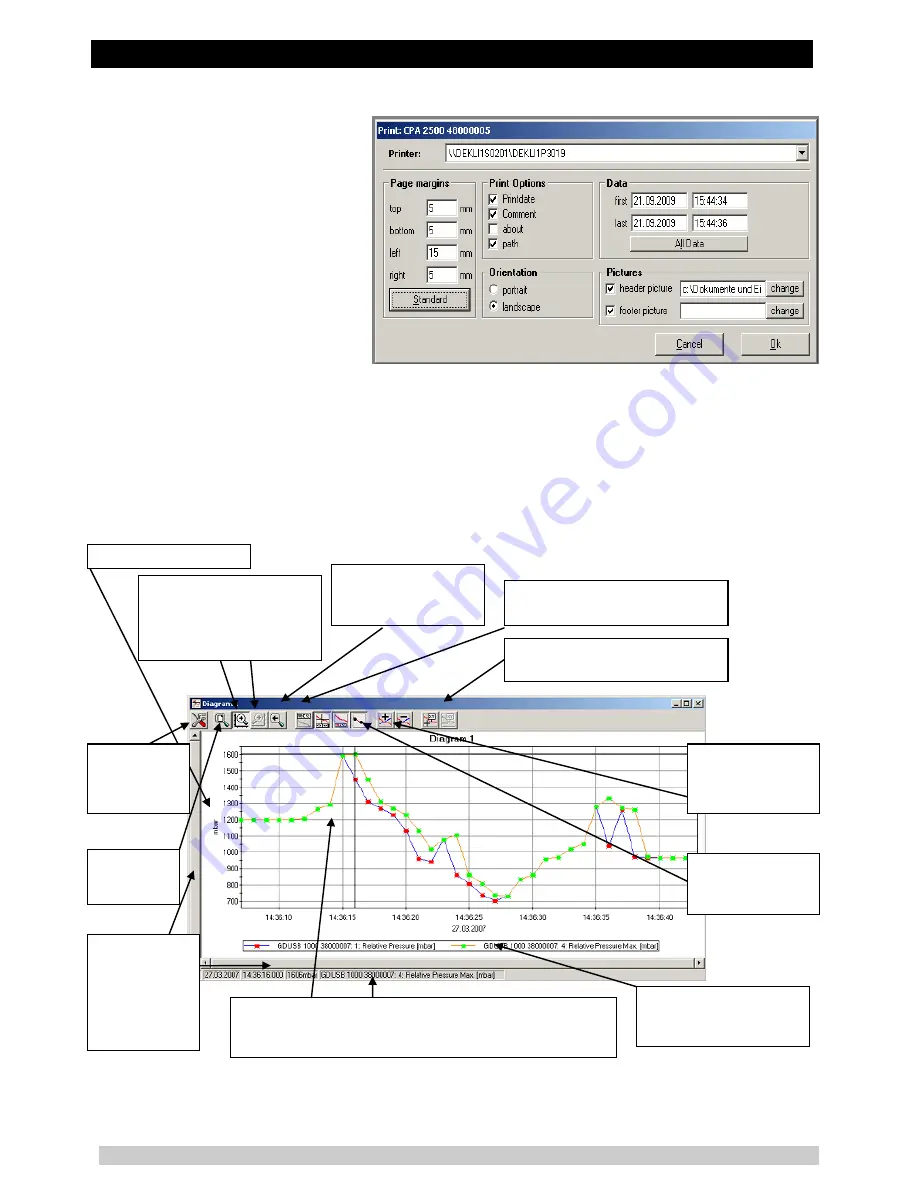
5.6 Measurement Diagrams
The loaded data of the measuring windows can also be displayed in diagrams.
Select for this „Create new diagram“ in the menu point „Diagram“. Then a selection of all possible
graphs will be displayed. Select the desired graphs and acknowledge your selection by pressing „Ok‟.
The diagram will be opened.
System limitations: - maximum 2 different units (mbar, bar, etc.) per diagram
- maximum 15 graphs per unit
Y-axis:
displays the unit
Legend
:
if activated a
description of the graph
will be displayed
Add / delete series:
the number of dis-
played graphs can be
changed (see below)
Settings:
manual zoom,
grid and colour
settings
Zoom back:
cancels last zoom
action
Zoom all:
show max.
diagram area
Display points:
display (marking) of
measuring points
Change name:
the diagram (here:
‚Diagram 1„) can be renamed
Cursor:
if activated a crosshair cursor will be displayed to
show the individual measuring points. The measuring point
data will be displayed in the status bar
Scrollbar:
if a
zooming action
has been carried
out the scrollbar
can be used to
‚go through the
diagram
Zoom left/right Y-axis:
choose here if the mouse
zoom function is to be ap-
plied to the left or right Y-
axis
Add / delete labels:
measuring
points can be described (see below)


