上海维宏电子科技股份有限公司
Weihong Electronic Technology Co., Ltd.
Specialized, Concentrated, Focused - 69 -
3.13.2 Part Statistic
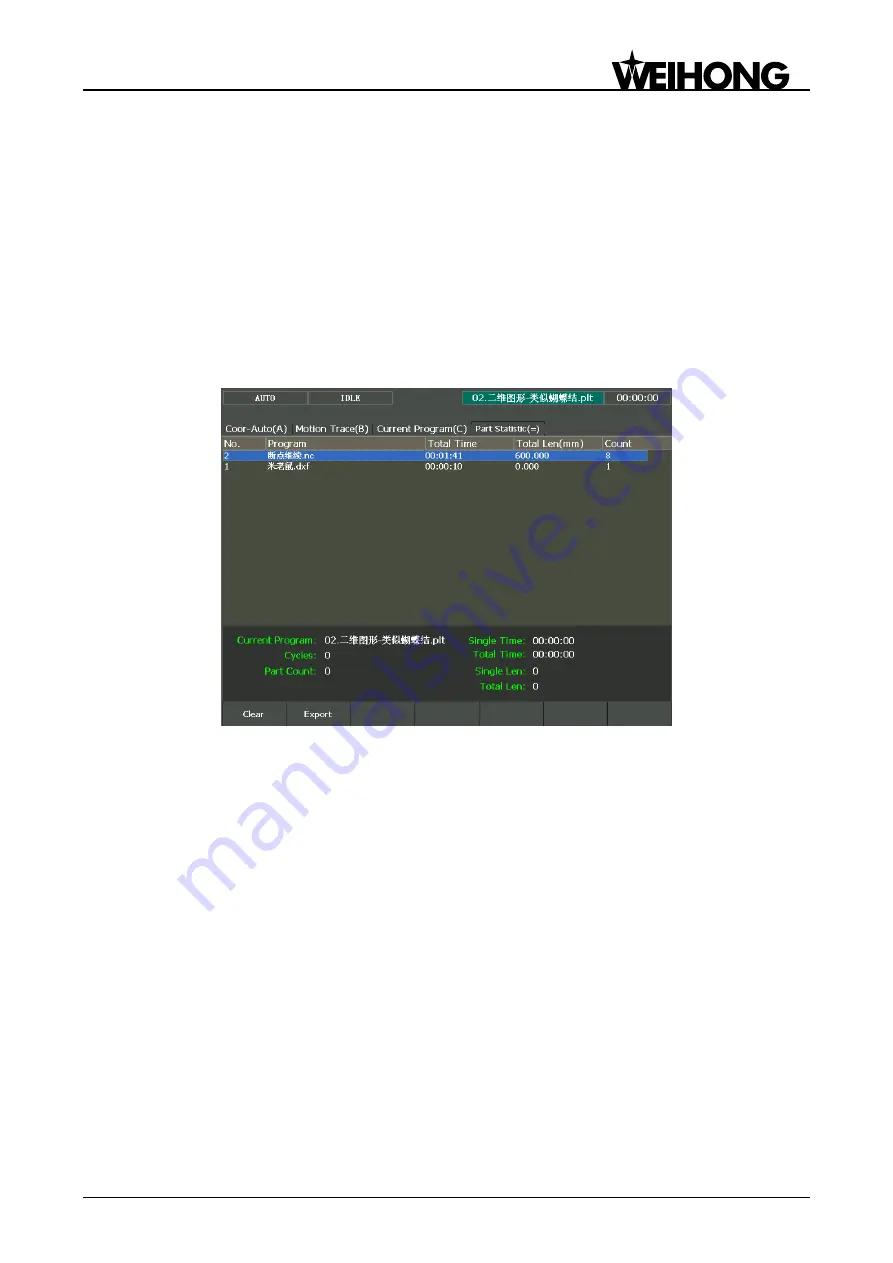
This screen mainly displays the statistics of current machining file and previously machined files.
Press ―State‖ button in Auto mode, and then press ―=‖ to enter [Part Statistic] screen, as shown in
Fig. 3-44. The upper part of this screen displays the machining info about the machined files, including
file name, total machining time, total machining length and machined times, while the lower part shows
the info about current machining file, like name, single time, total time, single length, total length, cycles
and part count. Among them, the c
ounterpart of ―Cycles‖ is the ―Prog Cycle Times‖ under ―Coor-Auto (A)‖
screen.
Pressing F1 will clear all historical statistics records on the list.
Pressing F2 can export statistics of all machined program files to a U disk or other external storage
in .txt format.
Fig. 3-44 Part statistic screen
3.13.3 Program File
Press function key ―Program‖ to enter [Program File] function area, mainly including [Local Program
(A)] and [USB File (B)] to be introduced.
[Local Program] is the default screen after entering [Program File] function area, as shown in Fig.
3-45. On the upper part of this screen, there is file list box displaying the processing files under the path
D:\NCFILES. On the lower part, the prompt box shows the path of the currently selected file and the
available space of driver. ―Progress‖ bar displays the schedule of ―Load‖ and ―Unload‖ operations.
Folders can be opened by pressing ―Enter‖. Besides, you can press combination key ―Shift+Bkspc‖ to
refresh the file list on the screen.


