


Appendix B - Measurement Specifications 151
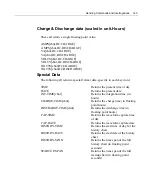
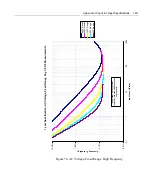
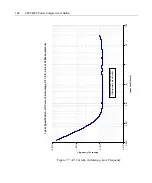
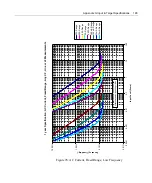
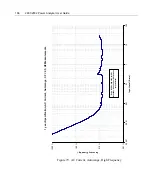
Startup Charts
Most results are available as a startup chart. The chart data is collected at
intervals of 1/1024
th
of the user set overall startup period. Data is combined
into the startup chart as the average or the maximum value (as applicable)
between each collection interval.
Waveform Data
The present voltage, current and power waveforms are stored in the
instrument. These are available plotted as measured, or with the fundamental
component removed, and/or with the DC component removed.
Captured Waveforms
The voltage, current and power waveforms are captured when a waveform
with a peak value, or with a non-fundamental component, is found which is
higher than a user set trigger level or that previously encountered (as specified
by the user).
Inrush Waveforms
The voltage and current waveforms are captured over a period of nominally
3ms before, and 65ms after, the detection of inrush.
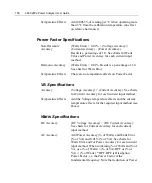
Line Switch
The internal line switch can be turned on and off by user controls. When
supplied with an AC voltage signal, the line switch can be programmed to
turn on at a specific phase (with 1° resolution) of the voltage signal. Turn off
is always at nominally zero current signal when an AC voltage is supplied,
otherwise the turn off is as commanded by the user. The line switch has the
following nominal characteristics -
Max. Open Voltage : 480Vrms (720Vpk)
Max. Surge Current : TBD
Max. On Current :
10Arms
Summary of Contents for Xitron 2801
Page 1: ...USER GUIDE 2801 2802 Advanced Single and Dual Channel Power Analyzers...
Page 2: ...2 2801 2802 Power Analyzer User Guide...
Page 10: ...10 2801 2802 Power Analyzer User Guide...
Page 101: ...Printing Results 101 Figure 66 Configuration Printout...
Page 102: ...102 2801 2802 Power Analyzer User Guide Figure 67 Waveform Channel 1 Real time...
Page 103: ...Printing Results 103 Figure 68 Waveform Channe1 Distortion...
Page 104: ...104 2801 2802 Power Analyzer User Guide Figure 69 History Chart VOLTS ACDC Trends View...
Page 105: ...Printing Results 105 Figure 70 History Chart AMPS PERCENT THD Extents View...
Page 106: ...106 2801 2802 Power Analyzer User Guide Figure 71 Harmonics Listing page 1...
Page 107: ...Printing Results 107 Figure 72 Harmonics Listing page 2...
Page 145: ...Sending Commands and Interrogatives 145...
Page 147: ...Appendix A Physical Specifications 147...


