


4.2.2. Timeline (Bottom-Center Box)
The “Timeline” represents a recorded video as a continuous waveform over its length. All frequencies are
represented in the one waveform and it grows and shrinks relative to the total SPL in the recording. Inside the
Timeline, a blue line marks the current position of the video. Above the Timeline are controls to play, stop, and
jump around the video in time, as well as a display of the current position. The position of the video may also
be fine-tuned; click and hold on the triangle above the blue marker and drag it back and forth to change the
current position. The Spectrogram Window (
) and video will always stay in sync with the blue marker; in
this way, different time segments of the video can be loaded into the Spectrogram Window for more detailed
analysis.
Specific segments of the video may be selected by clicking in the Timeline Ruler (4.1 #13); while holding Ctrl,
click and drag across and area to be analyzed; the selected area will appear in the Audio Spectrogram.
There are also toggle buttons to enable/disable the Virtual Reality Module
), and to switch the
projection mode of the video
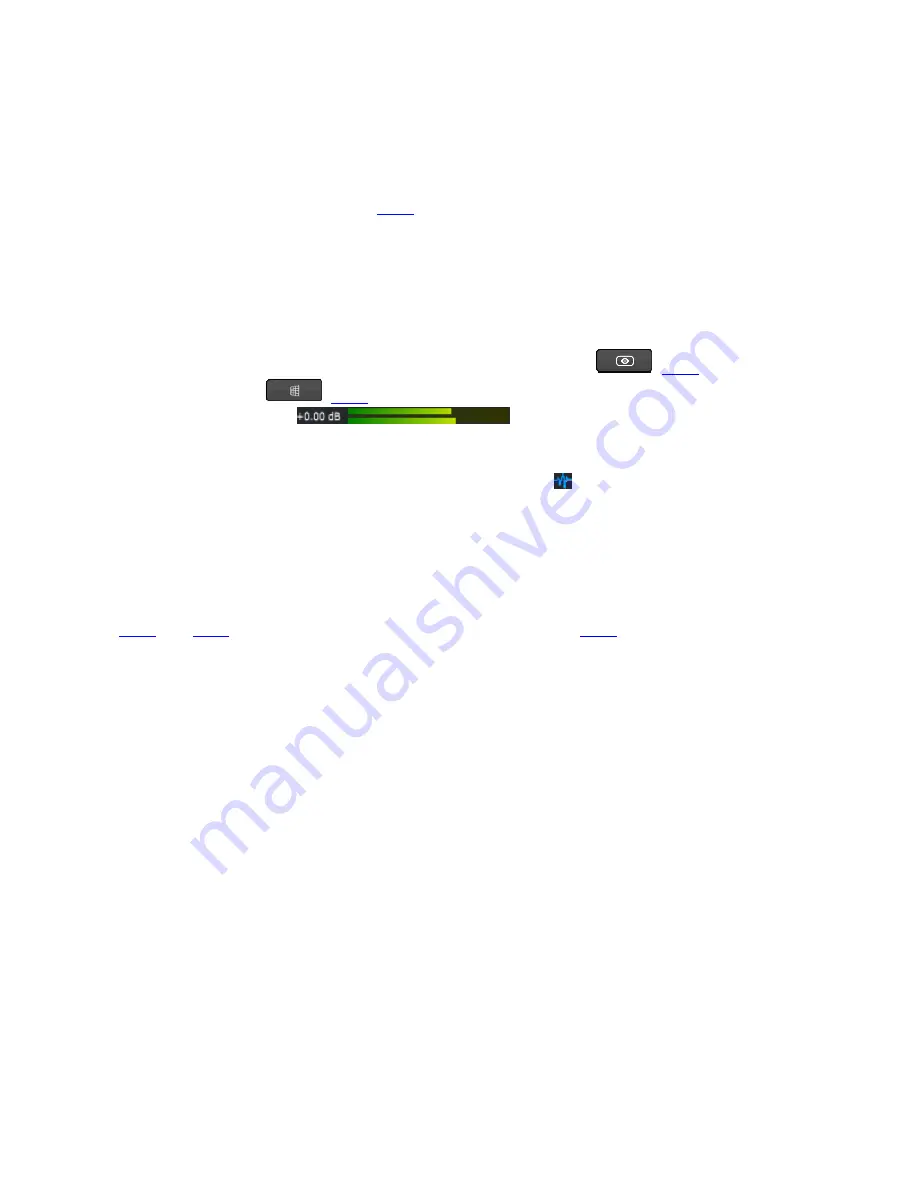
). In the bottom left, there is a gain display and volume meter for the
final stereo output of the program
. Click and drag the gain text to edit the output
gain level; double-click the level meter to open volume controls in a separate window. The horizontal slider at
the bottom can be used to look at different sections of the timeline. Clicking and holding on the end of the slider
adjusts the timeline scale. Click and drag on the blue waveform icon
between the volume meter and slider
to adjust the height of the audio tracks and the height of the audio waveforms to see finer detail.
4.2.3 Control Panel (Bottom-Right)
This window contains controls for Acoustic Image generation. It also has a separate Beamform tab to show the
currently active beamforms. More information on how each of these controls affect the image can be found in
sections
. Beamform information can be found in section
4.2.4 Spectrogram Window (Upper-Right)
When Realtime mode is active or a recorded session has been loaded, this window displays a color gradient
spectrum indicating the SPL of all viewable frequencies (250Hz-7000 Hz) over time. The color guide on the
right side of the spectrogram shows the specific SPL of a given color and may be adjusted with the vertical
slider next to it. Sliding down/up will increase/decrease the gain of SPL across the entire frequency range in
the spectrogram. Adjusting this slider can make all frequencies more visible by highlighting weaker frequencies
and reducing the gradient noise of very loud frequencies. To zoom the visible frequency range of the
Spectrogram Window in or out, use the mouse wheel while holding the cursor over the window.
● Selecting a Time/Frequency Range
From the spectrogram, users can select a time/frequency range for more detailed analysis of recorded
sessions. An area of interest may be selected with the mouse; left-click and drag to draw a box in the
spectrogram.


