© 2020 Virginia Diodes, Inc.
—All Rights Reserved
7 October 2020
The sensor is sensitive to small internal temperature gradients; measurements as indicated in the Display will drift slowly in
response to many influences, but this drift is small. Typical drift level does not usually exceed ~50 µW under normal conditions
and is frequently much less.
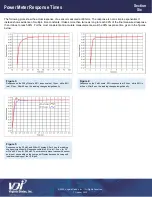
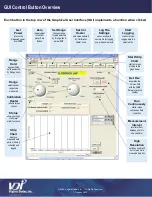
Each power range selectable on the Front Panel of the PM5B is tuned to operate as fast as
possible with acceptable noise and drift. Higher scales have faster responses, so it is
recommended to use the highest scale with sufficient resolution. Switching ranges
upward is practical with short settling times. Switching from higher to
lower power ranges requires a longer wait for the thermal transient to
settle. Switching more than one position downward requires a longer
time to settle; it is recommended to avoid going up in scale if you plan to
immediately return to a lower scale. After switching ranges from high to
low (particularly from 200 mW to 200 µW), the sensor will drift for one to
two hours. This drift will be slow enough to permit use within 10-15 minutes. A
complete settling to the original zero may take a few hours.
The sensor also drifts in response to ambient temperature. This drift is partially compensated during manufacture, but the residual
drift is ~2
W/°C. Higher drift may be seen due to ambient temperature variation if the temperature changes too fast for the sensor
to stay in full equilibrium; full equilibrium takes over one hour to achieve under such conditions. Significant drift and zero offset can
be induced by physically rotating the sensor head.
A noticeable source of apparent drift is due to the wideband response of the sensor. The sensor response band extends from 60
GHz to at least the visible spectrum, and so it responds to thermal emission from any object. Viewing an object only a few
degrees warmer than the surroundings produces a response.
When measuring very low power levels (below 10
μ
W), it is essential that the sensor be connected to the source for at least a few
minutes with the source
“OFF” to establish the zero level. With the meter stabilized and zeroed, turn on the source without
disturbing the connection to the sensor. If the source produces significant heating when
“ON,” this can still produce a response
that mimics output power in two different ways: first, through simple thermal conduction down the connecting waveguide; second,
through wideband thermal emission. It is critical when measuring low power levels to be sure you are not measuring a simple
heating effect.
When measuring power levels <10
μ
W, the following procedure is recommended:
1. Allow the meter to stabilize;
2. Make a base measurement with no RF power applied to the sensor;
3. Apply RF power to the sensor;
4. Wait an appropriate amount of time determined by the range of the meter and accuracy required (see Section 6);
5. Take the power measurement;
6. Calculate the difference between this power measurement and the baseline measurement, this is the detected power;
7. Repeat this procedure and average the detected power as necessary.
Settling Times and Drift
Section
Four


