STATISTICS
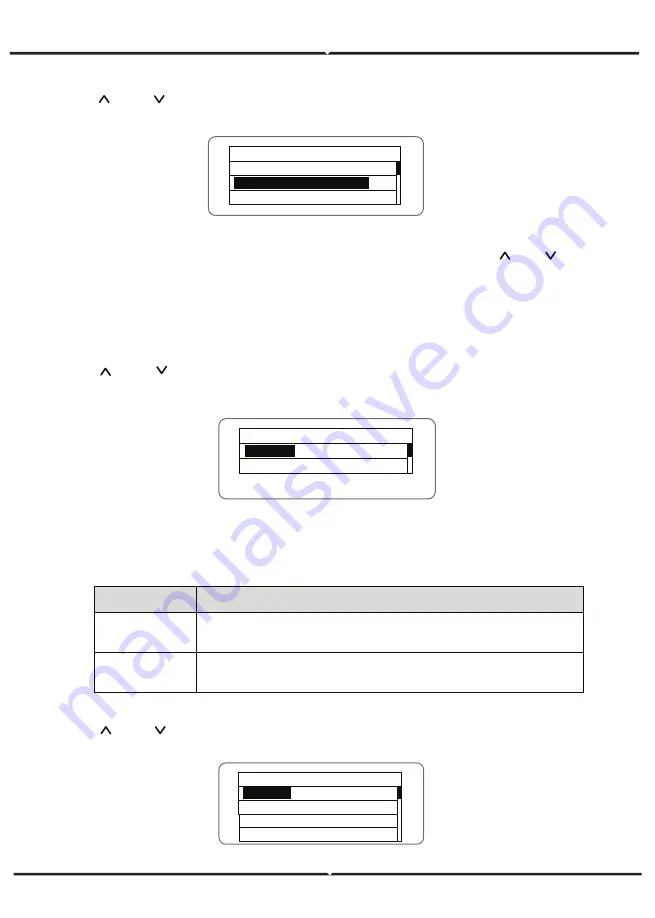
Press “ ” and “ ” in the main interface to select “Statistics”, and then press “ENT”
to view the parameters which is shown in Figure 28 .
HISTORY
Press “ ” and “ ” in the main interface to select “History”, and then press “ENT” to
view the parameters which is shown in Figure 27.
PARAMETER SETTINGS
Press “ ” and “ ” in the main interface to select “Setup Menu”, and then press “ENT” to
view the parameters which is shown in Figure 29.
The information in table below can be viewed in the statistical menu.
S ta ti st ic al M en u
L if et im e
T od ay
Figure 28 Statistic information
Figure 27 History parameters
Table of statistic information
S et up M en u
A dd re ss
C as h / p ri ce
D at e / T im e
L an gu ag e
Figure 29 Setting information
H is to ry
0
2 01 2 / 0 1 / 0 5 1 1 : 3 2 : 1 6
A 0 05 : G ri d un de r fr eq
“Historical record” can display 32 pieces of historical information, press “ ” or “ ”
key to look through the historical information, press “ESC” to return. The number on
the upper right corner of the first row is the number of historical record, the 2nd row
(as shown in Fig 27) displays the date and time when fault occurred or restored, and
the 3rd row displays detailed information of fault code. When the 3rd row displays in
inverse color, it indicates fault occurred, otherwise it is fault restored.
Content
Detailed
Lifetime
Total operation time, total power produced, total power saved, total CO
2
reduction in lifetime
Day statistics
Total power produced, total power saved, peak power and total CO
2
reduction in current day


