Page: 20
< Librae instruction manual
4 Operation
4 Operation
Librae instruction manual >
Page: 21
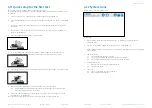
4.3 Setup
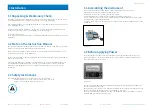
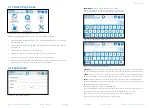
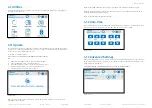
Use the Setup page (Figure 4.3.1) to configure the parameters of the experiment:
1. Animal Max Weight: this value allows you to rescale the histogram and the plot chart
during the measurement. Moreover, this value is used during the autostart procedure.
Use a numeric value from 20g to 4400g.
NOTE: if the value is not set correctly, the autostart procedure may not work as ex-
pected. Refer to paragraph 4.6 for more details
NOTE: in manual start mode, the correct value rescales the graph, optimizing the
display of graphical data.
2. Measurement Duration: this value is the maximum duration for the experiment. Numeric
value range is from 1 second to 360 seconds.
NOTE: If necessary, it is possible to STOP the experiment before the elapsed time-out, just
push STOP virtual button (or pedal switch).
3. Start Mode: this sets the operative start mode of Librae. Manual mode allows you to START/
STOP the experiment by pushing the virtual buttons on the screen.
Autostart mode lets Librae automate the start of the experiment..
Refer to paragraph 4.6 for more details.
Figure 4.3.1
4.4 Start
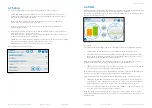
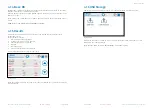
START screen (Figure 4.4.1) enables the starting and stopping of an experiment. Apply ZERO (tare)
to the measurement (if necessary), and see the applied force distribution.
This feature is particularly useful to check the animal position inside the restrainer, and if the
experiment is running correctly.
Figure 4.4.1
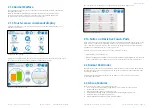
Ehorizontal
lements displayed on the START page (from left to right) provide the following functionality:
1. (i) INFO button. This button displays a pop-up windows with experiment details
2. Histogram. This graph displays the weight distribution between Left paw and Right paw.
The weight in grams is also displayed. A horizontal dynamic line allows users to check if
the weight is equally distributed between both paws.
NOTE: the horizontal dynamic line shows the half weight of the animal (this is the expected
weight per paw). This means “how much weight gap” is present between paws.
3. ZERO button. This button applies a “zero balance” to Librae. Use this only if the instrument
is not already in zero position prior to the experiment start.
NOTE: Librae performs a zero balance EVERY TIME the start page is selected. DO NOT APPLY any
force before selecting the start page, APART FROM TARE IF IT IS REQUIRED..
NOTE: Press ZERO button IF a negative weight is shown by histogram or by numeric values.
4. START/STOP button. This contextual button allows users to start or stop the experiment.
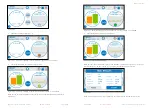
Press START to run the experiment. Press STOP to cease it. The trial results window dialog
will be displayed (see figure 4.6.7). Accept or reject the experiment data to proceed.
5. Time Scroll Graph. This graph shows the weight of both paws over time. This allows users
to see the “story” of the signal during the experiment.
NOTE: This graph is for visualization purpose only! Some peaks or spikes may not be visible.
Librae acquires and saves data from the force transducer at maximum speed. Export the .csv file
for data analysis.


