– 1
8
–
ë
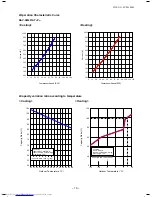
Capacity variation ratio according to temperature
>
g
n
it
a
e
H
<
>
g
n
it
a
e
H
<
>
g
n
il
o
o
C
<
SVM-13072_001-050.indd 16
SVM-13072_001-050.indd 16
11/08/13 1:27 PM
11/08/13 1:27 PM
0
1
2
3
4
5
6
7
8
9
1-2. Operation Characteristic Curve
RAV-
GM301
AT
P
<Cooling>
10
0
10
20
30
40
50
60
70
80
90 100 110 120
Compressor Speed (rps)
Curr
ent
(A
)
0
1
2
3
4
5
6
7
8
9
0
10
0
2
0
4
30
50
0
6
0
7
0
8
90 100 110 120
Compressor Speed (rps)
Curr
ent
(A
)
Conditions
Indoor : DB 27
o
C/WB 19
o
C
Outdoor : DB 35
o
C
Air Flow : High
Pip Length :
7.5
m
Voltage : 230V
Conditions
Indoor : DB 20
o
C
Outdoor : DB 7
o
C/WB 6
o
C
Air Flow : High
Pip Length :
7.
5m
Voltage : 230V
50
55
60
65
70
75
80
85
90
95
100
105
32 33 34 35 36 37 38 39 40 41 42 43 44 45 46
Outdoor temp.
(℃)
C
apac
ity
r
a
tio (
%)
Conditions
Indoor:DB27
℃/
WB19
℃
Indoor air flow:High
Pipe length:
7.
5m
0
20
40
60
80
100
120
-15
-10
-5
0
5
10
Outdoor temp.
(℃)
Heating Capacity
ratio (%
)
Condition
Indoor:DB20
℃
Indoor air flow:High
Pipe length:
7.
5m
Voltage : 230V
Voltage : 230V
Capacity ratio:100%=3.
4
kW
Capacity ratio:100%= 2.5kW
FILE NO. SVM-18042


