24
Using the Scratchpad
The icon for the selected tool is displayed at the top left on the work
area. Point to the icon to view a tooltip about how to use the selected
tool.
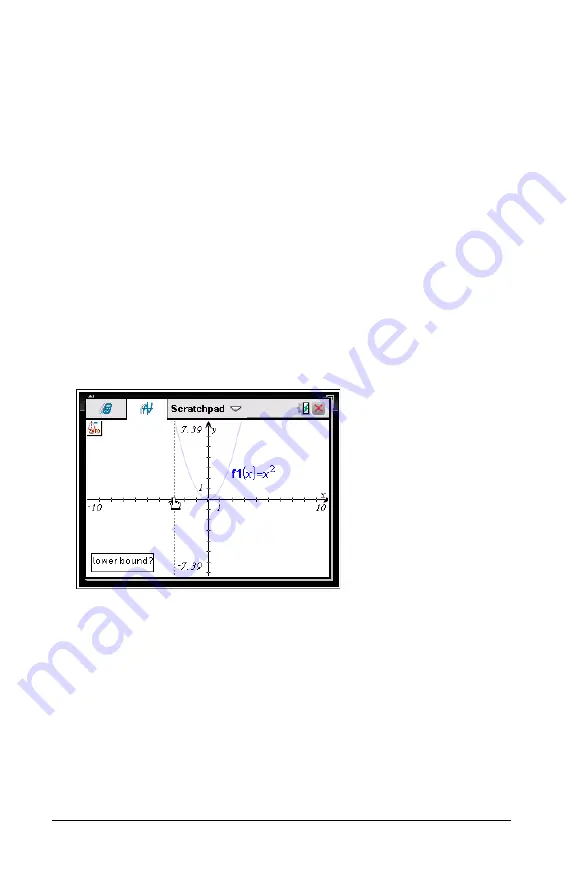
2. Click the graph you want to search for the point of interest, and then
click a second time to indicate where to start the search for the point.
The second click marks the lower bound of the search region and a
dotted line is displayed.
Note:
If you are finding the derivative (dy/dx), click the graph at the
point (numeric value) to use for finding the derivative.
3. Press
¡
or
¢
to move the dotted line that marks the search region, and
then click the point at which you want to stop the search (upper
bound of the search region).
4. Press
·
at the point to start the search. The tool shades the range.
If the search region you specified includes the point of interest, a
label for the point is displayed. If you change a graph that has points
of interest identified, be sure to check for changes in points of
interest. For example, if you edit the function on the entry line or
manipulate a plot, the point where the graph intersects zero can
change.
The labeled points of interest remain visible on the graph. You can
exit the tool by pressing
d
or choosing another tool.
Integral
b 6 6
b 6 7
Analyze Conics
b 6 7
b 6 8
non-CAS
CAS
Summary of Contents for TI-Nspire CX
Page 6: ...vi ...
Page 58: ...52 ...
Page 68: ...62 ...
Page 98: ...92 Memory and File Management ...
Page 108: ...102 ...


