


12
G
ETTING
S
TARTED WITH THE
CBR 2™
S
ONIC
M
OTION
D
ETECTOR
©
2000
V
ERNIER
S
OFTWARE
&
T
ECHNOLOGY
Activity 1—Graphing Your Motion
(cont.)
Linear
Î
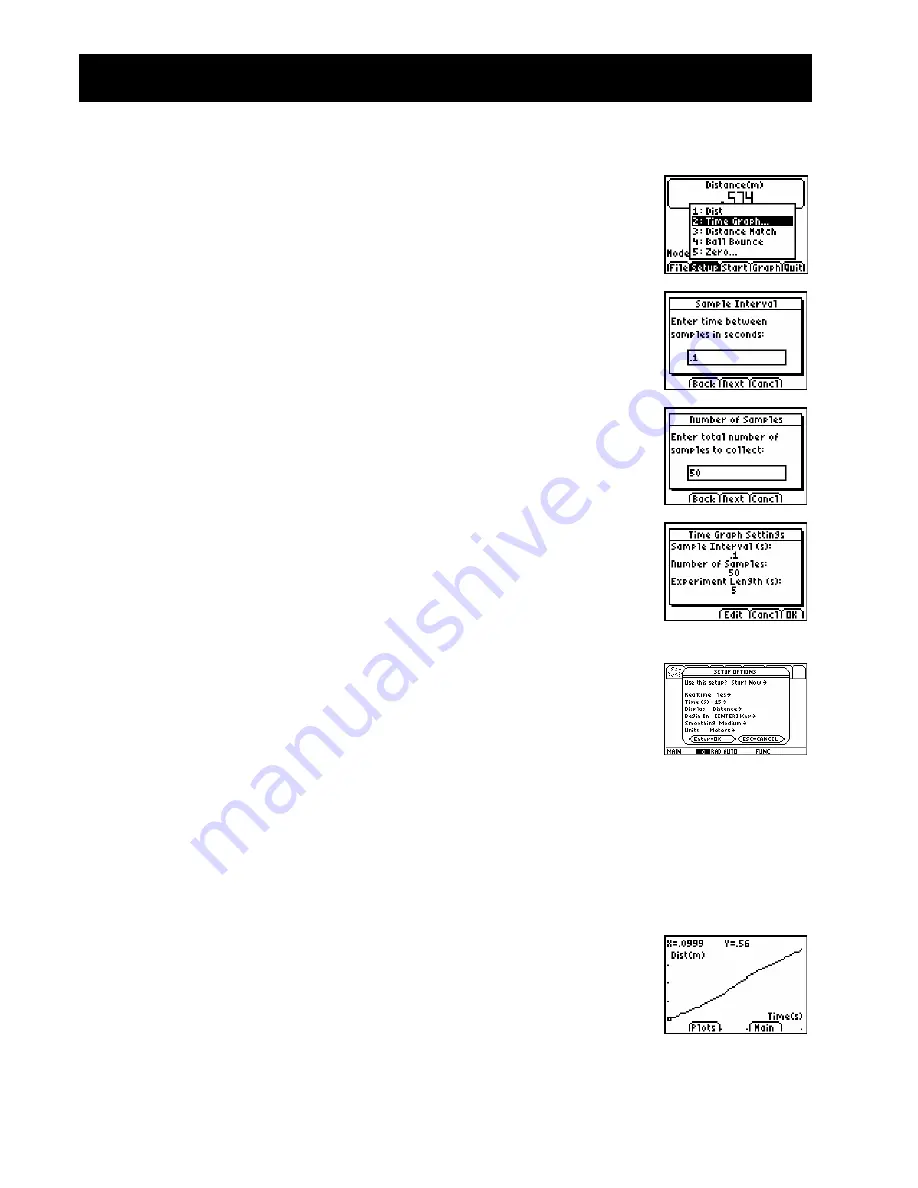
To set up the calculator for data collection using EasyData:
TI-83/84 Family users
a. Select
Setup
(press
p
) to open the
Setup
menu.
b. Press 2 to select
2: Time Graph
to open the
Time Graph
Settings
screen.
c.
Select Edit (press
q
) to open the
Sample Interval
dialog
window.
d. Enter 0.1 to set the time between samples to 1/10 second.
e. Select
Next
(press
q
) to advance to the
Number of
Samples
dialog window.
f.
Enter 50 to set the number of samples to collect.
The experiment length will be 5 seconds (number of
samples multiplied by the sample interval).
g. Select
Next
(press
q
) to display a summary of the new
settings.
h. Select
OK
(press
s
) to return to the main screen.
To set up the calculator for data collection using RANGER:
a. Choose 1:Setup/Sample… from the Main Menu.
b. Use
C
D
to move to each parameter line. Use
B
to view
the options for each parameter. To change a parameter,
highlight the options and press
¸
.
TI-89/Titanium/92+/V200
Ï
Explore making distance
vs
. time graphs.
a. Stand at the 1.0-m mark, facing away from the
CBR 2™
motion detector.
b. Signal your partner to select
Start
(press
p
).
c.
Slowly walk to the 2.5-m mark and stop.
d. When data collection ends, a graph plot is displayed.


