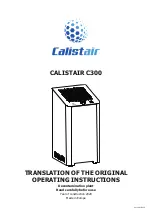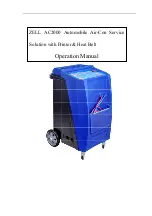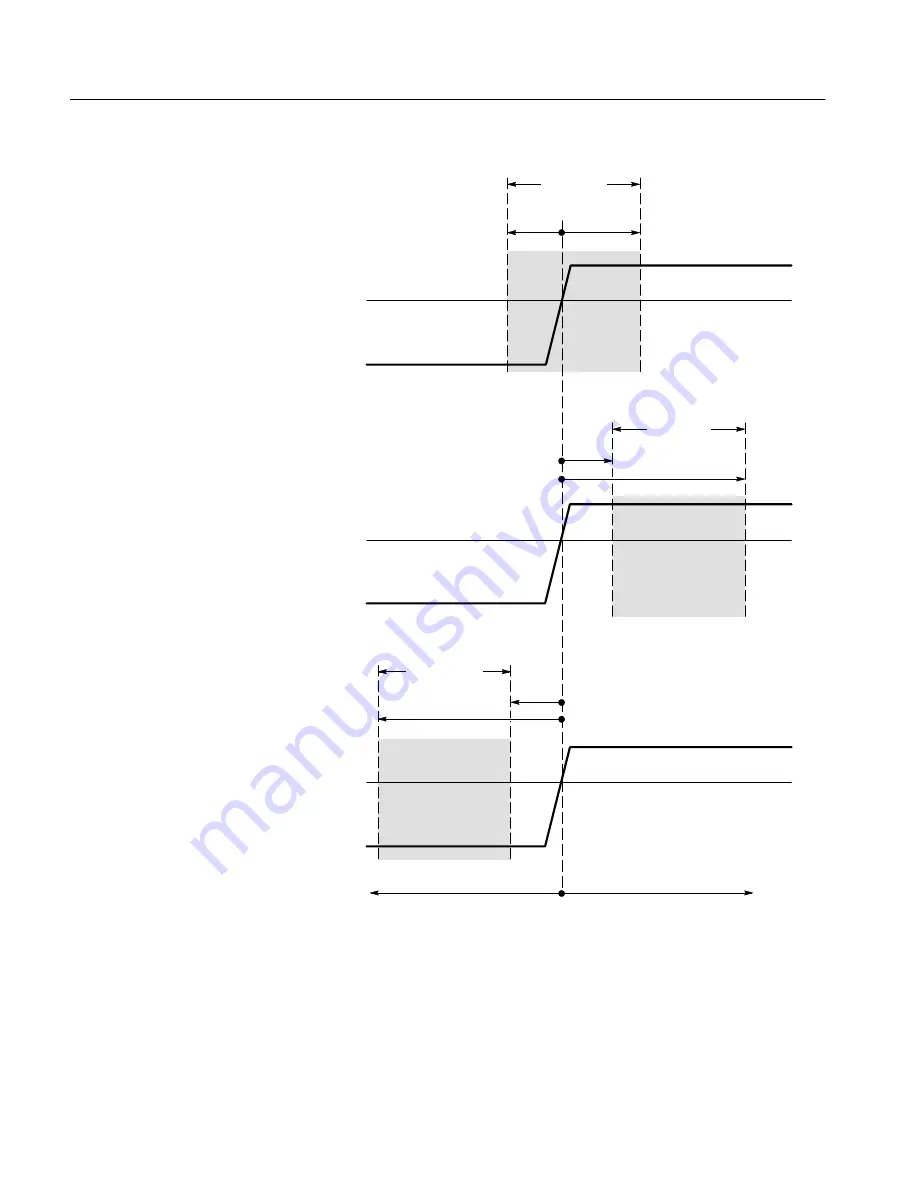
Triggering on Waveforms
3–90
TDS 500D, TDS 600B, & TDS 700D User Manual
Clock Signal
Clock Level
T
S
= Setup Time
T
H
= Hold Time
Setup/Hold Violation Zone = T
S
+ T
H
T
S
+ T
H
must be
+2 ns
Clock Signal
Clock Level
Clock Signal
Clock Level
Negative T
S;
Positive T
H
Positive T
S
; Negative T
H
+T
H
+T
H
–T
S
–T
H
+T
S
+T
S
Setup/Hold
Violation
Zone
Setup/Hold
Violation
Zone
Setup/Hold
Violation
Zone
Figure 3–44: Violation Zones for Setup/Hold Triggering
Summary of Contents for 071-0130-00
Page 4: ......
Page 12: ...Table of Contents viii TDS 500D TDS 600B TDS 700D User Manual ...
Page 18: ...Preface xiv TDS 500D TDS 600B TDS 700D User Manual ...
Page 19: ...Getting Started ...
Page 28: ...Operating Basics ...
Page 30: ...Overview 2 2 TDS 500D TDS 600B TDS 700D User Manual ...
Page 60: ...Tutorial 2 32 TDS 500D TDS 600B TDS 700D User Manual ...
Page 61: ...Reference ...
Page 65: ...Overview 3 4 TDS 500D TDS 600B TDS 700D User Manual ...
Page 185: ...Triggering on Waveforms 3 124 TDS 500D TDS 600B TDS 700D User Manual ...
Page 257: ...Saving Waveforms and Setups 3 196 TDS 500D TDS 600B TDS 700D User Manual ...
Page 300: ...Appendices ...
Page 310: ...Appendix A Options and Accessories A 10 TDS 500D TDS 600B TDS 700D User Manual ...
Page 328: ...Appendix B Algorithms B 18 TDS 500D TDS 600B TDS 700D User Manual ...
Page 330: ...Appendix C Packaging for Shipment C 2 TDS 500D TDS 600B TDS 700D User Manual ...
Page 340: ...Appendix F Programmer Disk F 2 TDS 500D TDS 600B TDS 700D User Manual ...
Page 341: ...Glossary ...
Page 355: ...Glossary Glossary 14 TDS 500D TDS 600B TDS 700D User Manual ...
Page 356: ...Index ...
Page 374: ...Index Index 18 TDS 500D TDS 600B TDS 700D User Manual ...
Page 375: ......
Page 376: ......