


22
Statistics
menu 2
7
7
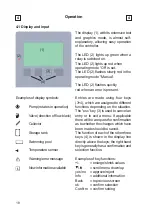
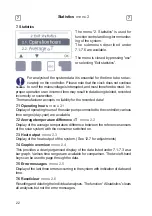
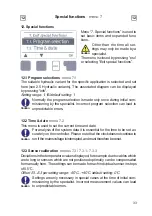
7. Statistics
The menu “2. Statistics” is used for
function control and long-term monitor-
ing of the system.
The submenus described under
7.1-7.6 are available.
The menu is closed by pressing “esc”
or selecting “Exit statistics”.
7.1 Operating hours
menu 2.1
Display of operating hours of the solar pump connected to the controller; various
time ranges (day-year) are available.
7.3 Heat output
menu 2.3
Display of the average temperature difference between the reference sensors
of the solar system with the consumer switched on.
7.2 Average temperature difference
∆
T
menu 2.2
Display of the heat output of the system. (See 12.7 for adjustments)
7.4 Graphic overview
menu 2.4
This provides a clearly-organised display of the data listed under 7.1-7.3 as a
bar graph. Various time ranges are available for comparison. The two left-hand
keys can be used to page through the data.
7.5 Error messages
menu 2.5
Resetting and deleting the individual analyses. The function “All statistics” clears
all analyses but not the error messages.
7.6 Reset/clear
menu 2.6
Display of the last three errors occurring in the system with indication of date and
time.
For analysis of the system data it is essential for the time to be set ac-
curately on the controller. Please note that the clock does not continue
to run if the mains voltage is interrupted, and must therefore be reset. Im-
proper operation or an incorrect time may result in data being deleted, recorded
incorrectly or overwritten.
The manufacturer accepts no liability for the recorded data!
Caution


