- 35 -
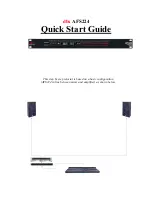
Fig. 6.18: Menu - Analysis Channels
6.2.5 Menu
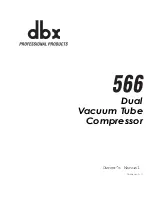
– Filter
Fig. 6.19: Menu Filter
Full Chart:
Upon activating this option the
respective curve will be displayed in full
chart mode.
Event Box:
Upon activating this option
coloured frames will mark the events of the
respective signals in the Raw Data
window.
Auto Size:
This option will scale the
amplitude of the curve automatically.
Marker:
It is possible to set reference lines
that will be displayed in the Analysis
Channels.
Minimum/Maximum:
Enter minimum/
maximum values to scale the signal.
Fill analysis events:
Event Boxes will be
displayed slightly shaded in colour.
Mark the respective checkboxes
to
filter a specific signal. Settings (in Hz)
for
Highpass
,
Lowpass
and
Notch
can be individually selected.
The filter settings could be saved as
a template (
1
).
Summary of Contents for SOMNOtouch RESP eco
Page 54: ...54 9 11 Notes...