

52
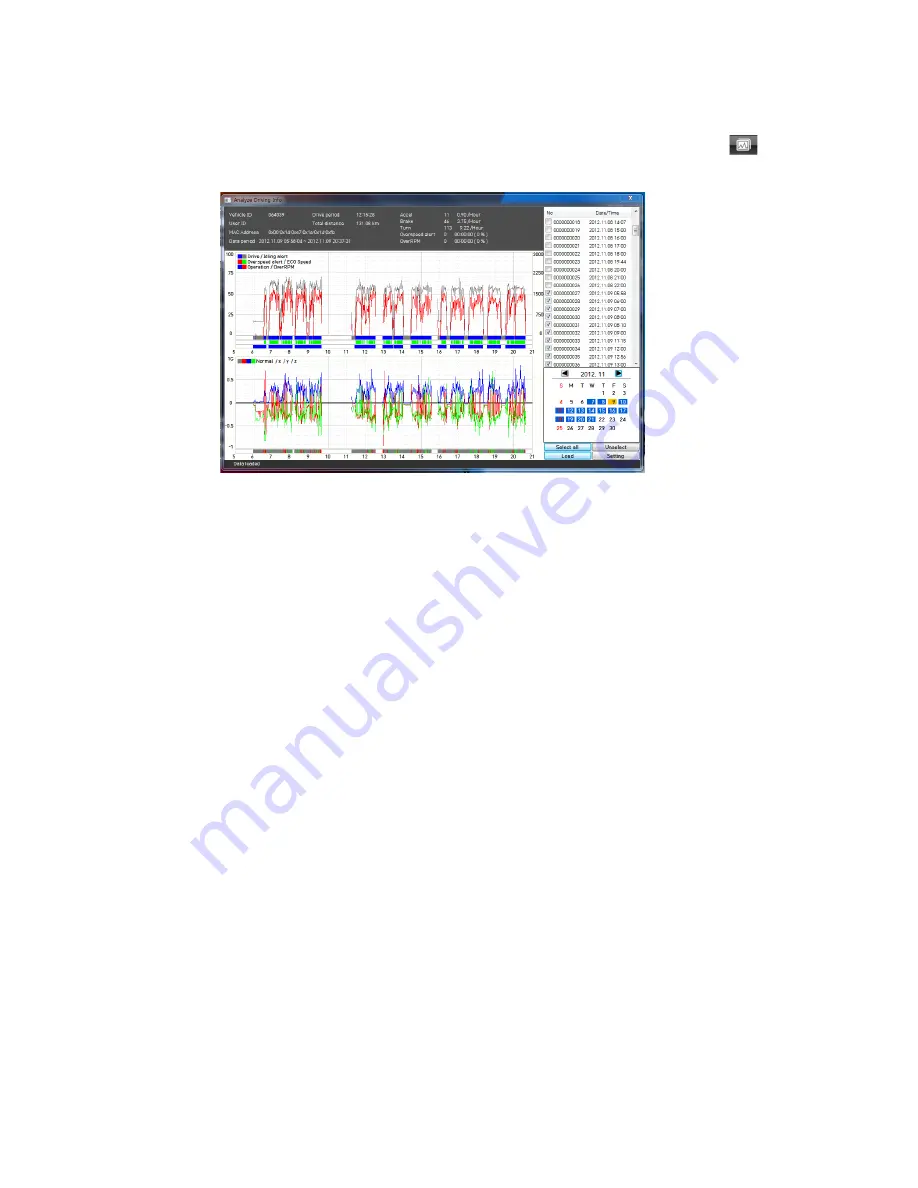
5-2. Analyze Driving Info
Ø
While playing back the selected data, click the View Information button
to view the below Analyze Driving Info screen.
Ø
From the calendar in the bottom right corner, choose the date you wish to
inspect among the dates highlighted in blue. Dates that are not highlighted in
blue, do not have the relevant data. All data from the selected date will be
automatically chosen from the selection on the right. You can unselect data
that you do not need. Click load for access.
* The time span for the data selected cannot exceed 24 hours.
Ø
A summary of information can be found on the top including vehicle ID; user
ID; total duration; total distance; and number of over-accelerations, over-
decelerations, sharp turns, over-speeding, over-RPMs that exceeded the pre-
set limit.
Ø
The top graph shows the speed (red) and RPM (grey) and right below are
three indicator bars that show driving patterns. The first bar shows driving
(blue) and idling (grey). The second bar shows the speed where white means
within both the permitted speed and eco-speed limit, green means above
eco-speed but within permitted speed limit, and red means above the legal
speed limit. The last bar shows the state of the engine where white means
the engine is off, blue means it is running properly within the pre-set RPM
limit, and red means over acceleration, i.e. exceeding the pre-set RPM limit.
Ø
The lower graph shows the G-sensors where the x-axis is in red, y-axis in
blue, and z-axis is green. The indicator bar right below shows jolts in the G-
sensor values, i.e. G-sensor values that exceed the pre-set limit. Grey means
normal conditions, red means jolts in the x-axis direction, blue in the y-axis
direction, and green in the z-axis direction.
* Axis' are based on the position of the main unit.
Ø
Configurations for this function can be set by clicking the [Setting] button in
the right bottom corner. The limits for g-sensor, permitted speeding,
excessive RPM, and eco-speeding can be set under the tab Analyze, and
ranges for the two graphs can be set under the tab Component.
Summary of Contents for SVC400GPS-L
Page 43: ...43 3 1 1 PC Viewer Control Buttons ...
Page 44: ...44 3 1 2 Control Buttons and Indicators ...
Page 57: ...57 Blurred Image ...
Page 86: ...86 Appendix C Recording Time Table ...
Page 87: ...87 ...
Page 88: ...88 ...