


Document Reference: X-0036-01-07 Cadmus & Ratifi Operating Manual
Drawn: 13/11/2020
Page 52 of 66
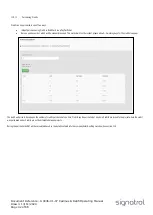
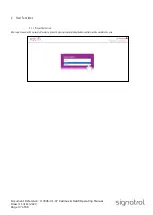
2.1.5.3
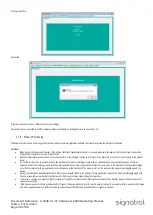
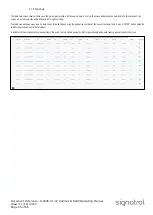
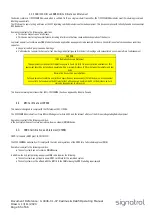
Using the graph
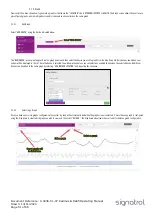
By default the graph
will load with the last 7 days data. If you wish to see data period outside the last 7 days, you must amend the “Data Period”
and then select
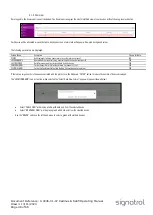
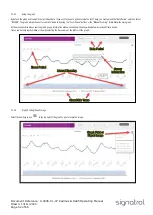
“RELOAD”. The graph allows the user to zoom into the data by using the “Zoom Period” buttons or the “Manual Zooming” slider below the main graph.
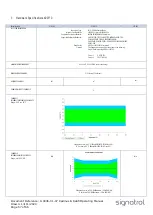
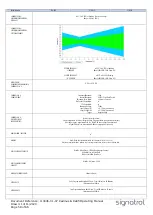
As the mouse position moves over the graph, popup information windows will appear showing when data was received from a device.
Traces can be temporarily hidden or show by selecting the trace name at the bottom of the graph.
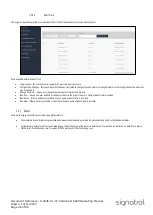
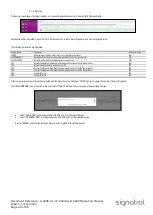
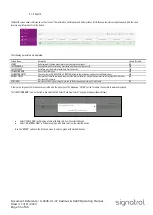
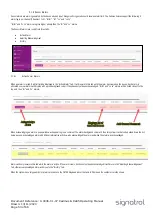
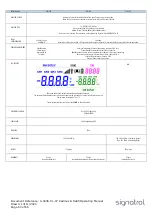
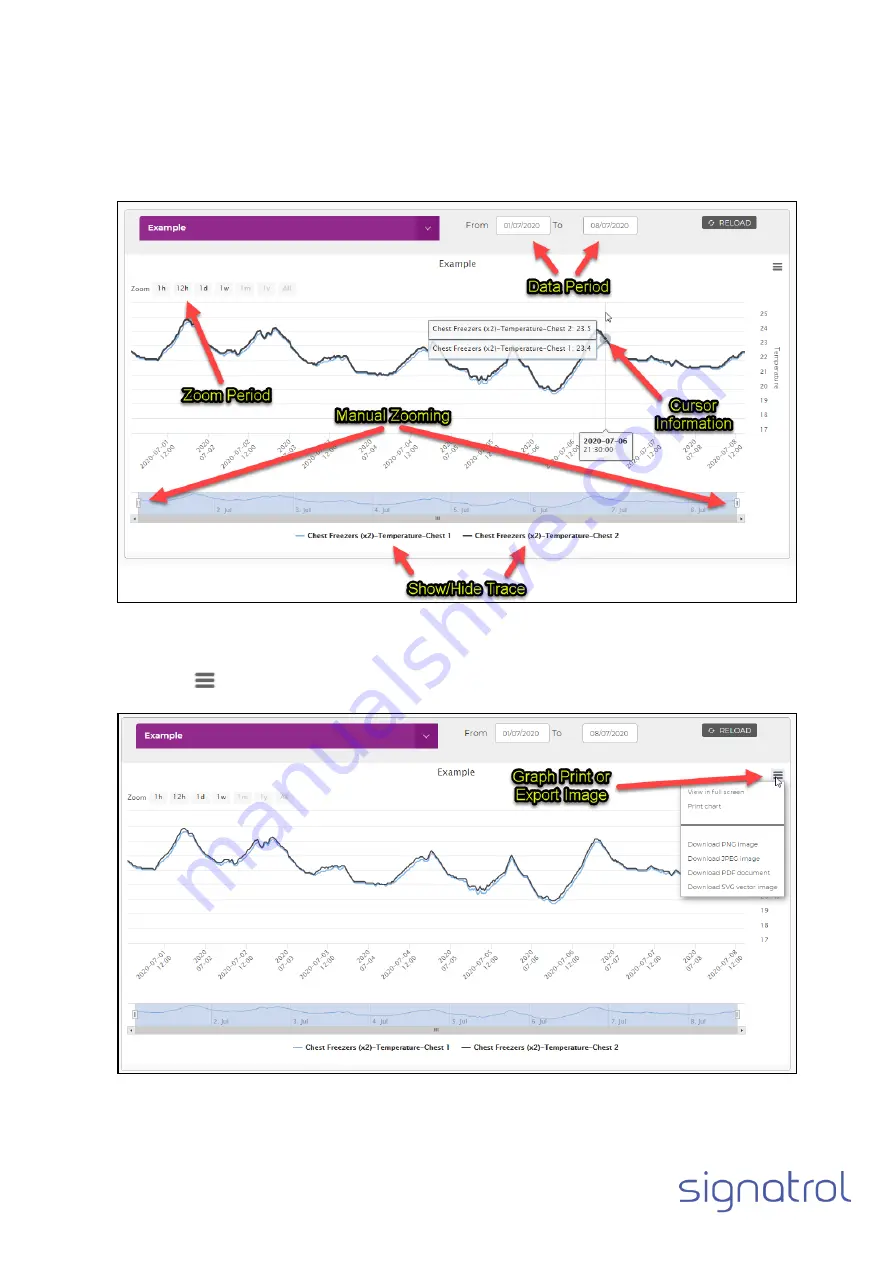
2.1.5.4
Graph Printing/Export Image
Select the hamburger icon
to the top right of the graph to print or export an image.


