


MANUAL
CT
Controllers
COMMUNICATIONS
Page 55
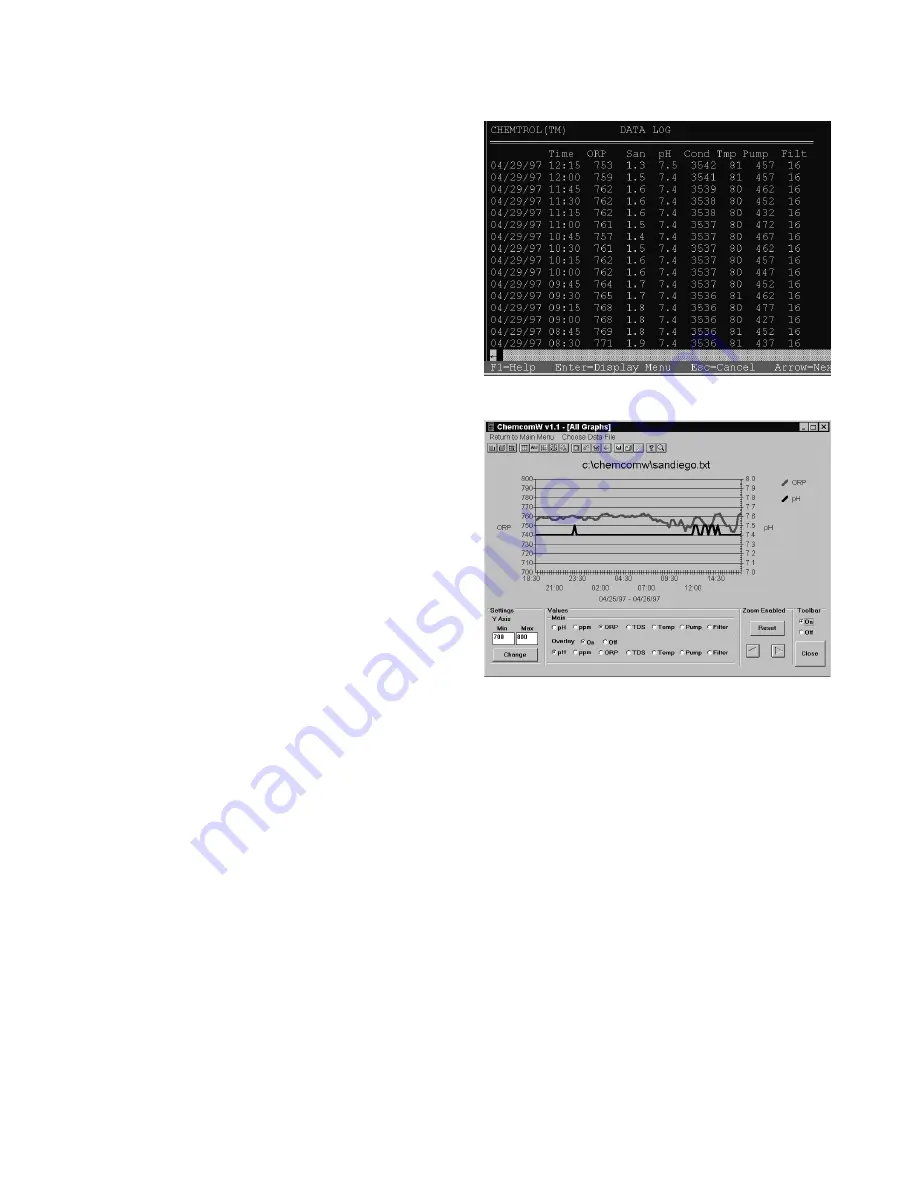
Log Display
Data logged in the controller can be downloaded on site or
remotely by computer, using the Submenu 8.2.4 for
Operations/Print Reports, as explained in Chapter II.
The data is stored as a text file in the computer. It can be
displayed as text data using any conventional word processor.
It can be displayed directly through the CHEMCOM
TM
program
- as shown on Figure - using Menu 8 DISPLAY DATA and
VIEW.
The test data can also be easily copied and incorporated into
other documents, such as reports to management or to the
health department.
Graphic Data Display
The data log can be displayed graphically with the
CHEMCOM
TM
software program, using Menu 8 for DISPLAY
DATA and GRAPH.
As shown on Figure , the graphics program displays two
parameters simultaneously, such as ORP as a main variable
and pH as an overlay, as shown on the right.
By clicking on the ZOOM ENABLE icon, windows can be
drawn around parts of the graphs to display enlarged and more
detailed views for selected dates or times. The left and right
arrows allow scanning of the graph in either direction. To
return to the full graph, click on ZOOM RESET.
The tool bar can be turned on to allow changes in scales, type
of display and colors.
Using the ALT/Print Screen WINDOWS command, the graphic
data display can also be copied as an image to other
documents or reports.
Figure 27 - Data Log Display
Figure 28 - Graphic Data Display