20
Altering Axis Attributes
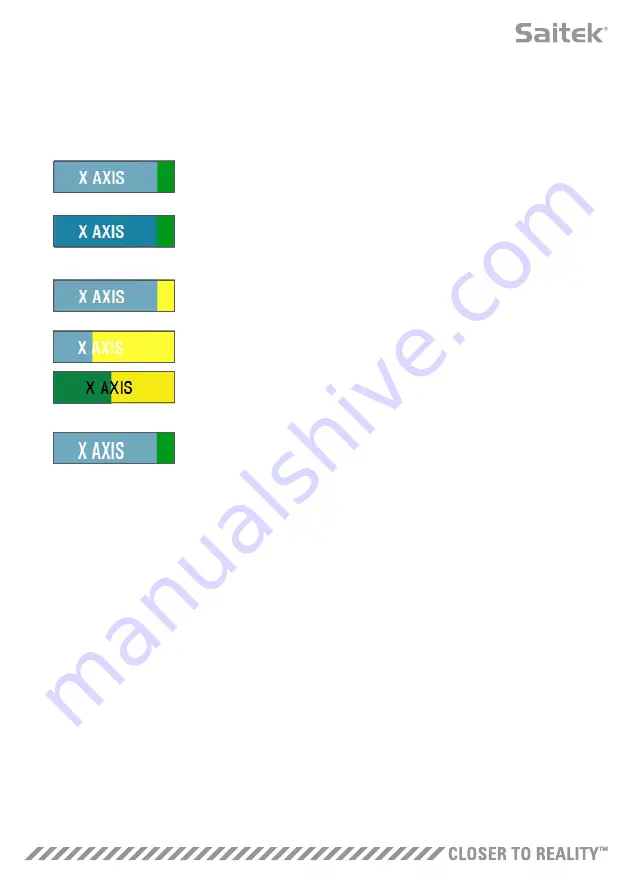
Axis Status Notifications
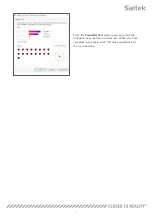
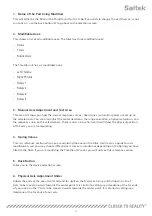
You’ll need to be aware of several notifications in the axis highlighter box when manipulating and
applying axis data. On the left is a list of the current device’s axes. The colors indicate the status of
each axis.
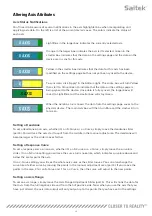
Light Blue in the larger box indicates the currently selected axis.
Orange in the larger box indicates the axis isn’t selected. Green in the
smaller box indicates that the data on the settings page and the data on the
device are in sync for this axis.
Yellow in the smaller box indicates that the data for this axis has been
modified on the settings page but has not yet been synced to the device.
To sync data, click ‘Apply’ in the bottom right. The entire box will turn Yellow
then start to fill up Green to indicate that the data on the settings page is
being synced to the device. Once data is fully synced, the larger box will
revert to Light Blue and the smaller box will stay Green.
When the Axis box turns Green, the data from the settings page saves to the
physical device. The main Axis box will then turn Blue and the slash will turn
to Green.
Setting a Deadzone
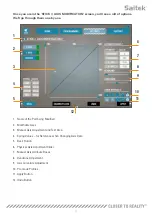
To set a deadzone on an axis, whether it’s an S-Curve or a J-Curve, simply move the deadzone slider
(part 8). You will see the axis start to split from the middle in the manual adjust area. The deadzone will
become larger as the slider moves farther.
Setting a Response Curve
To set a response curve on an axis, whether it’s an S-Curve or a J-Curve, simply move the curvature
slider. On an S-Curve setting you will see the curve turn snake-like, which indicates curvature above and
below the center point the axis.
On a J-Curve setting you will see the whole axis curve as the slider moves. You can also change the
curvature of either curve by moving the points in the manual adjustment area (part 4). If you move the
points in the area, 2 for an S-Curve and 1 for a J-Curve, then the curve will adjust to the new points.
Setting an Axis Range
To set an axis range, simply move the Axis Range Adjustment Slider (part 5). This will shrink the data for
that axis from the full negative side and from the full positive side. Now when you use the axis that you
have just altered, the axis data output will only output up to the points that you have set in the settings.

