background image


2.2


Screen layout of HortiMaX-Go! 

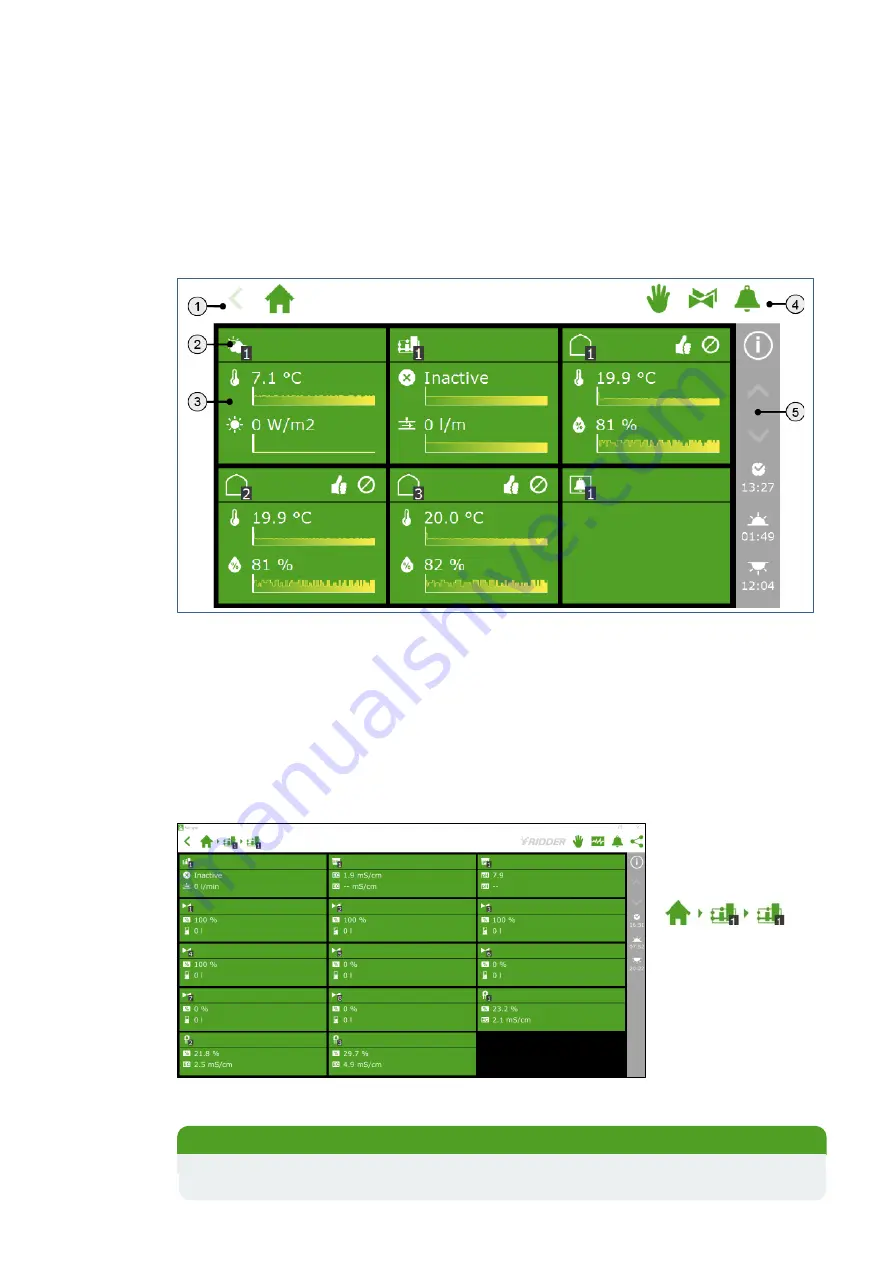
The main screen of the HortiMaX-Go! is the home screen. The home screen displays a 

number of fixed elements, such as the tiles, the top bar and the right sidebar. 
The screenshot below shows an example of the home screen. What the home screen 

looks like exactly on your system depends on your configuration. 


1.


Top bar, left-hand side, showing the breadcrumb trail 

2.


Tile header 

3.


Tile body, showing specific information 

4.


Top bar, right-hand side, providing direct access to manual control, valves and 

alarms 

5.


Right sidebar 


2.3


Setting up sensor to display moisture data 


You can find the moisture 

sensors after the valves 

in the valves overview:  


This screen shows the 

EC [mS/cm] and the 

moisture content [%] 

measured by each 

sensor. 


Values*


EC in [mS/cm]

  Moisture content in [%]   Temp. in [°C]  

Minimum 

0.0 


-40 

Maximum 

25.0 

100 


 60 


Summary of Contents for HortiMaX-Go

Page 1: ...V 010 03 02 2022 Quick Start Guide Moisture Sensor...

Page 2: ...dder com helpdesk gs ridder com This product is subject to the General Conditions of Ridder Growing Solutions B V This document may not be copied or made public by means of print photocopy digital cop...

Page 3: ...idder Moisture Sensor can be connected to the following Ridder process computers CX500 MultiMa and HortiMaX Go Only operate the equipment if you are familiar with how these process computers work This...

Page 4: ...with the HortiMaX Go The moisture sensor sends the measurement data via the MTV Go to the HortiMaX Go This data can be displayed using one of the control panel units shown below Control panel cabinet...

Page 5: ...our configuration 1 Top bar left hand side showing the breadcrumb trail 2 Tile header 3 Tile body showing specific information 4 Top bar right hand side providing direct access to manual control valve...

Page 6: ...to set the alarm limits for the moisture content the EC and the temperature of the substrate If necessary set a delay time for the alarms Go to the settings for the valve groups Here you enter the st...

Page 7: ...n below You will now see the averages and the minimum and maximum values over a 24 hour period To compare data over a longer period of time in a graph you can use the icon below to generate a graph fr...

Page 8: ...nsor After selecting the valve group navigate the following path You can see when and at which moisture content level an irrigation cycle started and also which sensor triggered the irrigation cycle S...

Page 9: ...an irrigation cycle from starting This means that if you have set a pause time and the moisture content is still too high after the pause time has elapsed the irrigation cycle will start regardless of...

Page 10: ......

Reviews: