2.4
Displaying the measurements
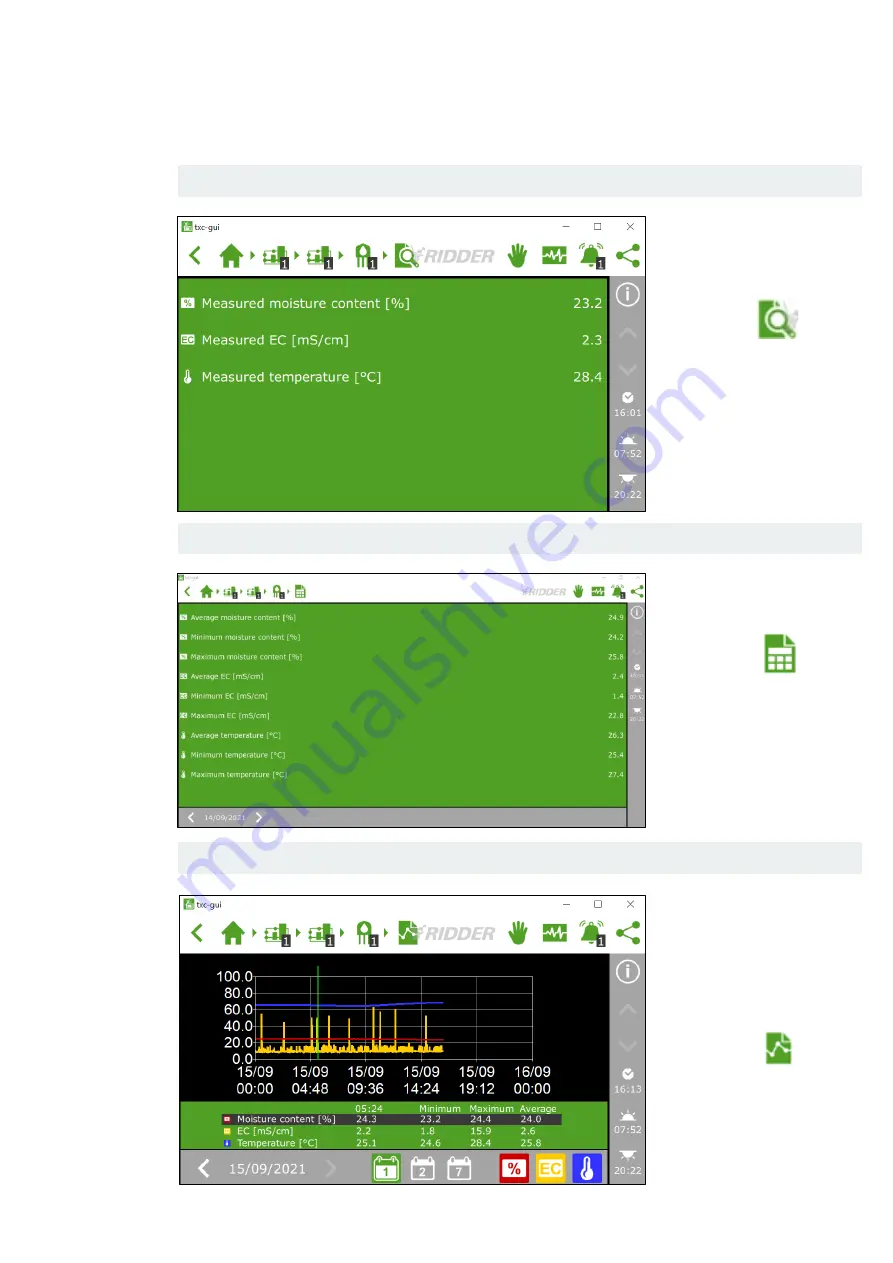
To display the
measurement data, tap
the magnifying glass icon:
You will now see the
measured values for the
moisture content, the EC
and the temperature of
the substrate.
Go to the moisture screen
and tap the icon below:
You will now see the
averages, and the
minimum and maximum
values over a 24-hour
period.
To compare data over a
longer period of time in a
graph, you can use the
icon below to generate a
graph from the moisture
screen:
Step 1:
Tap the magnifying glass icon on the moisture sensor screen.
Step 2:
To view the historical data for the last 24 hours, proceed as follows:
Step 3:
To view these values over a longer period of time, proceed as follows:
Summary of Contents for HortiMaX-Go
Page 1: ...V 010 03 02 2022 Quick Start Guide Moisture Sensor...
Page 10: ......


