20
QUANTEX GmbH 2014
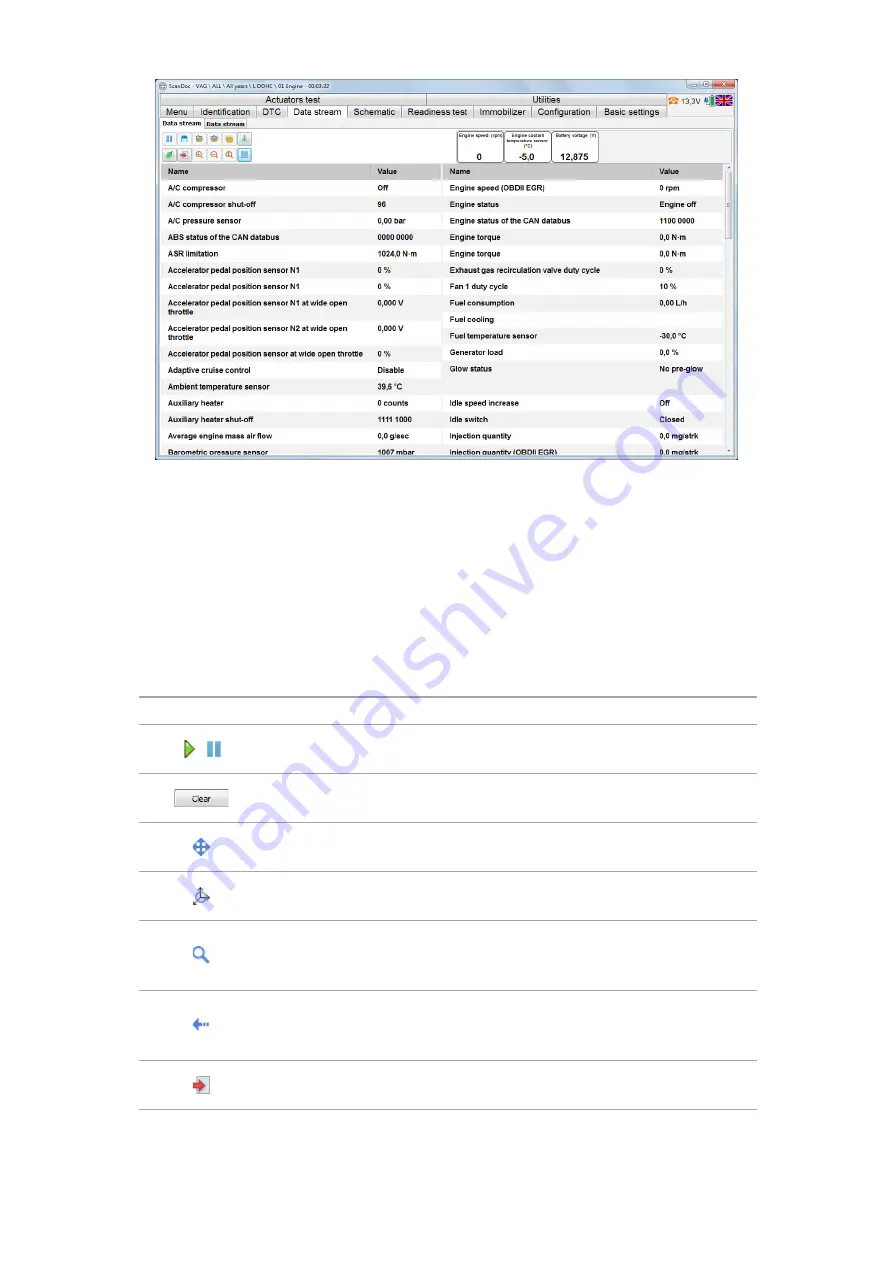
Picture view of all the options simultaneously enables to overview quickly.
If a picture is 3D viewed, it’s necessary to choose the axes to display the graphs.
If two options are indicated, there will be a 2D mode, if 3 options are indicated,
then there will be a 3D mode. One can set minimum and maximum values on the
axes for each option to view in detail.
Graphs data will be viewed as points linked together by lines.
Buttons Description of 3D Graphs Window.
Button
Description
Start / Stop
It activates or stops the options cycling mapping mode
Clear
It discards 3D picture. The graphs start drawing again.
Graphs axes transfer
It helps to transfer the graphs axes manually.
Graph turn.
It helps to rotate the graphs around the axes manually.
Zoom change
It helps to zoom in (with the left mouse button) or zoom out (with the
right mouse button) the graphs size.
Changes reset.
It restores all the graphs settings defaulted. It adds the graphs to the
protocol.
Add to the protocol.
It adds the graph to the protocol.


