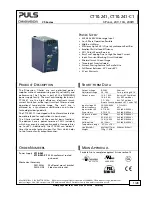


CT10.241, CT10.241-C1
CT-Series
3-P
HASE
,
24V,
10A,
240W
May 2018 / Rev. 2.0a DS-CT10.241-EN All values are typical figures specified at 3x 400Vac, 50Hz input voltage, symmetrical
phase voltages, 24V, 10A output load, 25°C ambient and after a 5 minutes run-in time unless otherwise noted.
www.pulspower.com Phone +49 89 9278 0 Germany
9/28
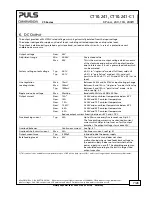
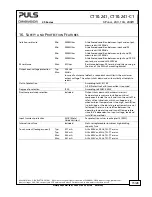
8.
E
FFICIENCY AND
P
OWER
L
OSSES
3AC 400V
3AC 480V
Efficiency
Typ.
92.8%
92.9%
At 24V, 10A, 3-phase operation
Typ.
92.4%
92.6%
At 24V, 10A, when using only two legs of a 3-
phase system, see also chapter 22.7.
Average efficiency *)
Typ.
92.2%
92.0%
25% at 2.5A, 25% at 5A, 25% at 7.5A. 25% at
10A, 3-phase operation
Power losses
Typ.
2.3W
2.6W
At 0A, 3-phase operation
Typ.
11.8W
11.8W
At 24V, 5A, 3-phase operation
Typ.
18.6W
18.3W
At 24V, 10A, 3-phase operation
Typ.
23.5W
22.8W
At 24V, 12A, 3-phase operation
*) The average efficiency is an assumption for a typical application where the power supply is loaded with 25% of the nominal load for 25%
of the time, 50% of the nominal load for another 25% of the time, 75% of the nominal load for another 25% of the time and with 100%
of the nominal load for the rest of the time.
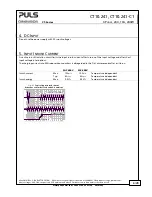
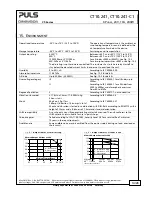
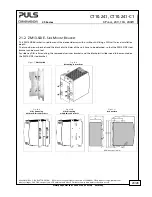
Fig. 8-1
Efficiency vs. output current at 24V,
typ., 3-phase operation
Fig. 8-2
Losses vs. output current at 24V,
typ., 3-phase operation
Efficiency
2
90
91
92
89
93%
12A
4
8
10
Output Current
6
3x480Vac
3x400Vac
Power Losses
0
2
4
8
10
12A
0
3
9
12
18
21
24W
Output Current
6
6
15
3x480Vac
3x400Vac
3x480Vac
3x400Vac
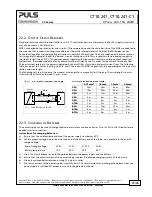
Fig. 8-3
Efficiency vs. input voltage at 24V,
10A, typ., 3-phase operation
Fig. 8-4
Losses vs. input voltage at 24V, 10A,
typ., 3-phase operation
Efficiency
350
400
450
500 3x550
Vaf
92.0
92.2
92.4
92.6
Input Voltage
92.8
93.0
93.2%
Power Losses
350
400
450
500 3x550
Vaf
17.0
17.5
18.0
18.5
Input Voltage
19.0
19.5
20W