d
AshboArd
The Dashboard is the first menu displayed when you launch the utility. The various submenus in the
Dashboard display status information (see table below for description). Use the System Monitor pull-
down menu to change frequency of system monitor functions.
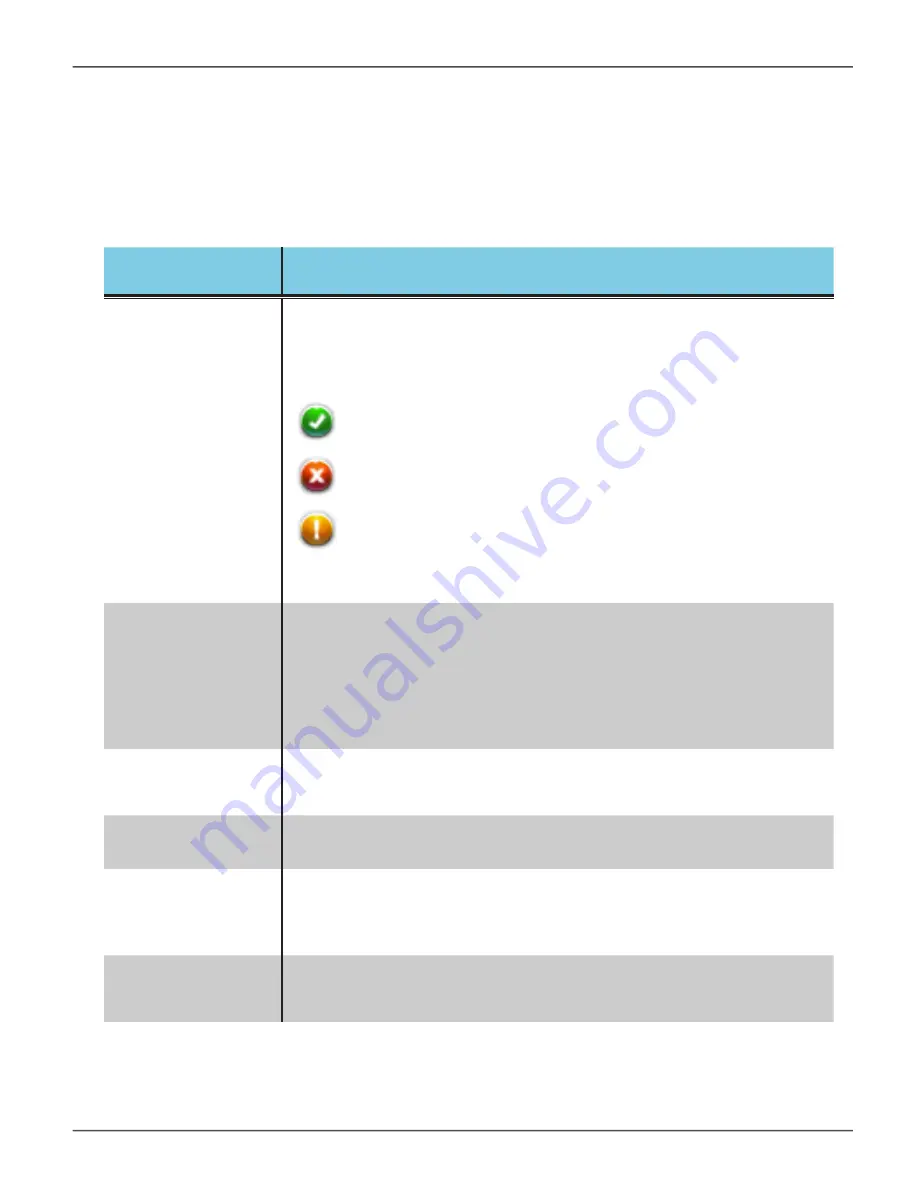
Dashboard menu Description
System Status
Provides a summary of the RAID, fan and temperature status. The color
coded icons let you know the condition of the hardware at a glance.
The green, yellow and red colored icons indicate the following
conditions:
System Monitor
Use this to change System Monitor settings or to disable it. This feature
is used to monitor the health of various components including hard disks
and the RAID. If it detects problems that might develop in the RAID,
physical drives, or other parts of the system where some predictive
analysis is possible, it will change the alert status accordingly and display
the status in the dashboard or other menus in the utility.
Note that the more frequently a system check is conducted,
Media Bay
Lists the basic information of the Media Pod, if one of the available pods
are installed. Information includes device type, storage capacity and
temperature.
HDD Storage Bay
Overview
Basic status information of the hard disk drives, if present. Information
includes storage capacity and temperature.
Fan
Fan status uses the same icon indicators as System Status to display
fan health status. Basic information includes current fan speed and
operational status. If you see a red or amber icon for the fan in the
System Status menu, look here for details.
Temperature
If you see a red or amber Temperature icon under System Status, check
the details in the Temperature submenu. This displays local temperature
status of the storage bays.
The green check mark indicates healthy status.
The red ‘X’ indicates failed or critical status. If this appears,
there is a serious problem with the component.
The amber exclamation point indicates there is a problem with
the component.
34
Pegasus2 R2+ Product Manual


