


FTIR3 Oil Analyzer
21
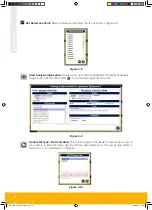
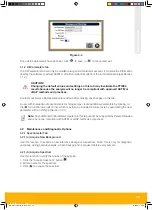
3.1.2 (c) “Results” Tab
The
Results
tab (Figure 3-14) displays the table of results for each sample, along with the date and time
the sample was analysed, and the User who performed the analysis.
Figure 3-14
Click on “
Percent
” to display the parameter values as percentage change from the reference, or click
on “
Actual
” to show values in absolute absorbance units.
Each parameter is listed in its own column. Click on any column heading to sort the list by that parameter.
Use the horizontal scroll bar to view all columns.
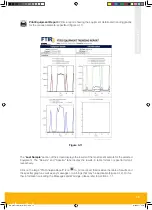
3.1.2 (d) “Spectra” Tab
The
Spectra
tab (Figure 3-15) displays the infrared absorbance spectrum of a selected sample or
multiple samples by holding
Ctrl
or
Shift
+ click.
Figure 3-15
MA-K31014-KW FTIR Issue 1.indd 21
14/03/2017 20:16


