NP36
User Manual V. 1.2
51
Logging
The Logging page lets you view logs and graphs to further investigate any issues on your network.
1.
Navigate to
Troubleshooting & Reporting
Logging
.
2.
Click the management group previously created.
3.
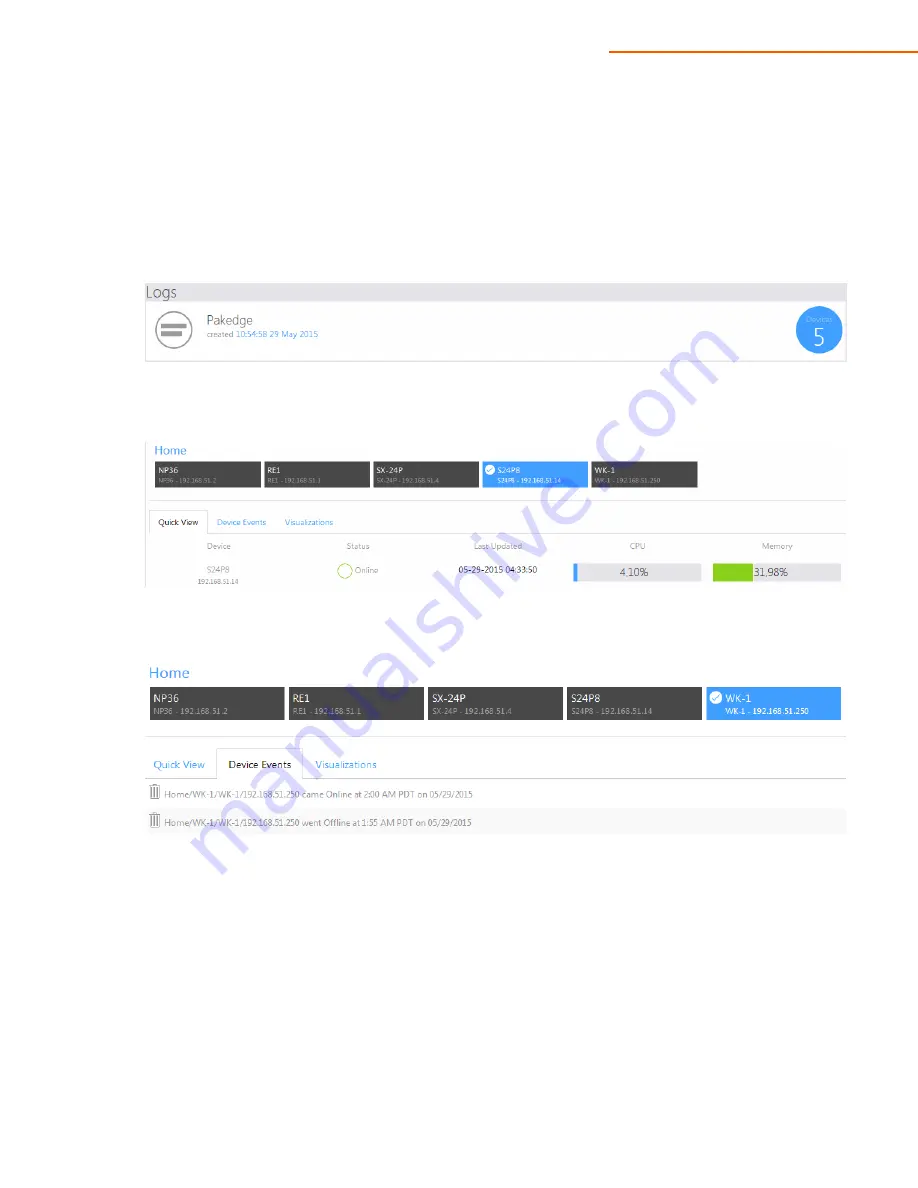
In this example, we will select a Pakedge S24P8 switch. We can see the CPU and Memory usage
under the Quick View tab.
4.
Device Events will display important events that have occurred. The following image shows the
timestamps of a Pakedge WK-1 access point that went offline and came back on.
5.
The Visualizations tab will graph various aspects of devices such as CPU, Memory, and
Online/Offline history. The following image illustrates this. You can download the graph as a PDF as
well.


