


16
The Summary information window shows the status of RAS and the information why this
status is shown. RAS can show the following statuses in this window:
Status
Color
Description
Normal
Green
Shows the RAS status is normal.
Caution
Yellow
Shows the RAS detected a recoverable error or some monitoring
functions are disabled.
Warning
Orange Shows the RAS detected an error to be recovered by an operator.
Failure
Red
Shows the RAS detected a serious error such as an Alive Error.
Note: You can change a message of the RAS status in [RAS Utility Settings] - [Others].
RAS Utility Toolbar buttons
Icon
Name
Description
Open Log File
Opens a log data file and displays the contents in the Log Viewer.
Save Log File
Saves the log data displayed in the Log Viewer to a file.
Read Latest Log
Data
Reads the latest log data from the RAS Board and displays the
log data in the Log Viewer.
RAS Settings
Displays the RAS Settings.
Help
Displays the RAS Utility Help.
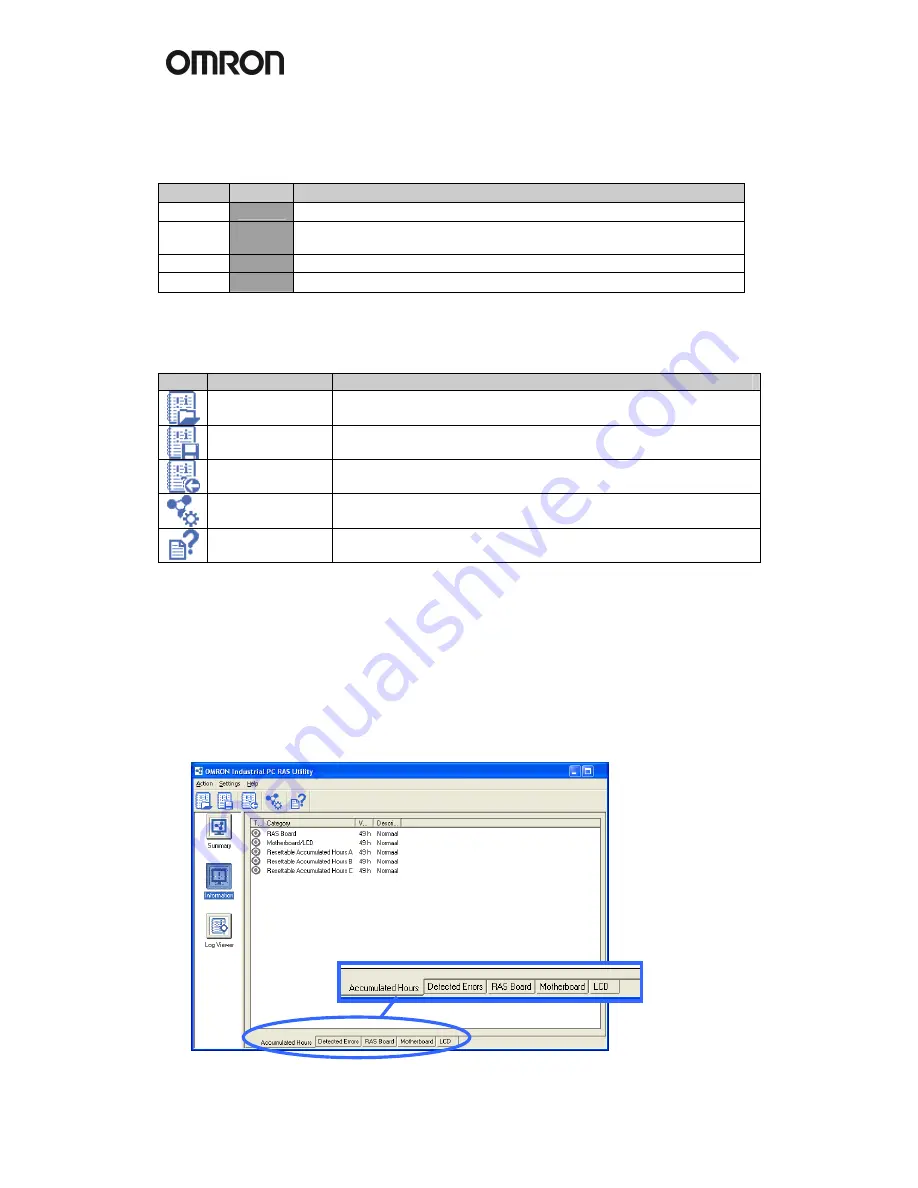
Information window
The information window will show specific information for each of the following areas:
•
Accumulated Hours
•
Detected Errors
•
RAS Board
•
Motherboard
•
LCD
Summary of Contents for DYALOX INDUSTRIAL PC
Page 2: ......
Page 3: ...Quick Start Guide DyaloX Industrial PC...
Page 4: ......
Page 7: ...3 2 1Specifications of all the DyaloX models...
Page 8: ...4...


