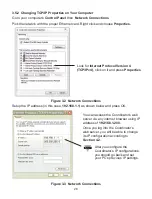


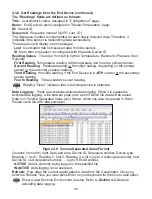


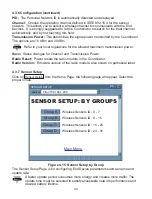


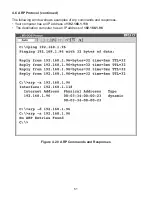


4.3.4 Chart
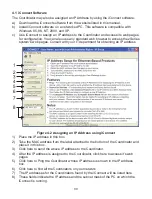
Click on
, from the Home Page,
the following page will appear. Select
the proper Group to view the Chart.
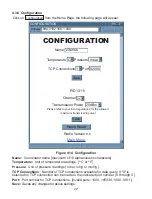
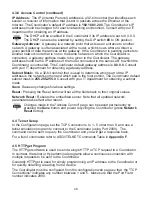
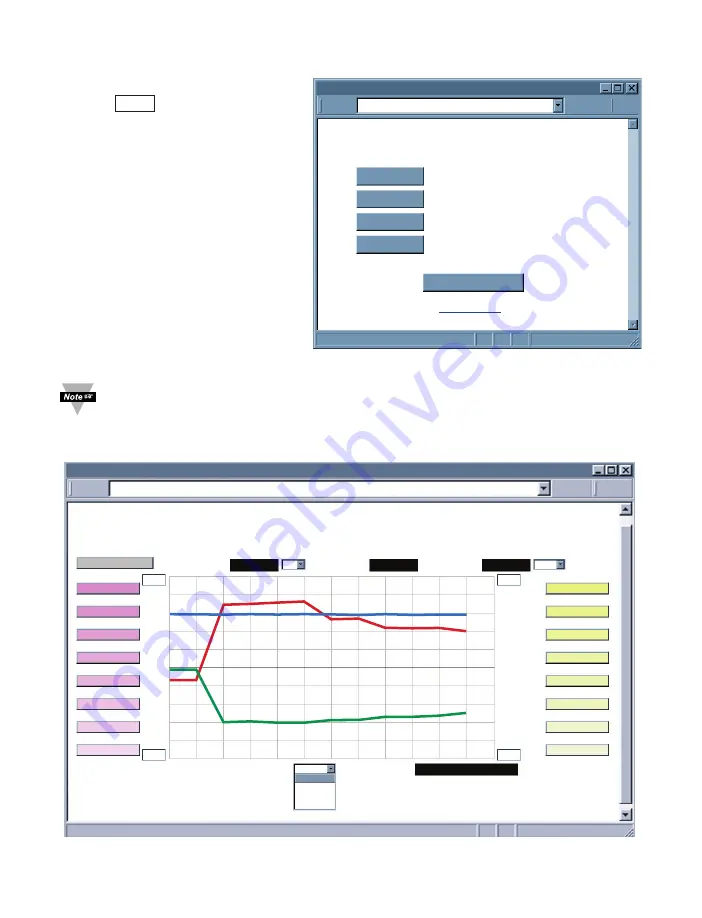
In a few seconds the following page
will appear. The Java™ Applet graph
displays Temperature, Humidity, and
Barometric Pressure.
It can be charted across the full span
(-40 to 124ºC, and 0 to 100% RH) or
within any narrow range (such as 20
to 30ºC).
Figure 4.11 Select Chart by Groups
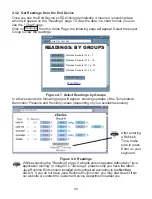
If a blank screen appears without any "java application running" or image of a
"Java logo", please verify you have the latest Java Runtime Environment
installed and configured according to the instructions (refer to
Section 4.3.3.1
).
If you do not have Java Runtime Environment, you may download it from our
website or contact the Customer Service Department nearest you.
Figure 4.12 Chart - End Device #1 LAB 50
CHART: BY GROUPS
CHART
http://192.168.1.200
Address
Main Menu
Wireless Sensors ID: 0 - 7
Wireless Sensors ID: 8 - 15
Wireless Sensors ID: 16 - 23
Wireless Sensors ID: 24 - 31
Sensor Setup
Group A
Group B
Group C
Group D
Chart
zSeries
Group A
Main Menu
CHART
(5 Seconds/Div)
1 Minute
1 Minute
1 Day
1 Week
1 Month
1 Year
0
5
C/Div
50
1200
300
100%
0%
10
%/Div
90
hPa/Div
LAB 50 RH
LAB 50 Pres
C
hPa
Tue Jun 5 18:11:55 PDT 2009
Tue Jun 5 18:05:27 PDT 2009
http://192.168.1.200
LAB 50 Temp
35
1009
/25
P0 Primary
P1 LAB 50
P2 LAB 100
P3 CLN RM1
P4 CLN RM2
P5 Primary
P6 OVEN5
P7 Primary
S0 Secondary
S1 LAB 50
S2 LAB 100
S3 CLN RM1
S4 CLN RM2
S5 Secondary
S6 OVEN5
S7 Secondary
Save Current Graph
39


