TagTemp-S
NOVUS AUTOMATION
6/11
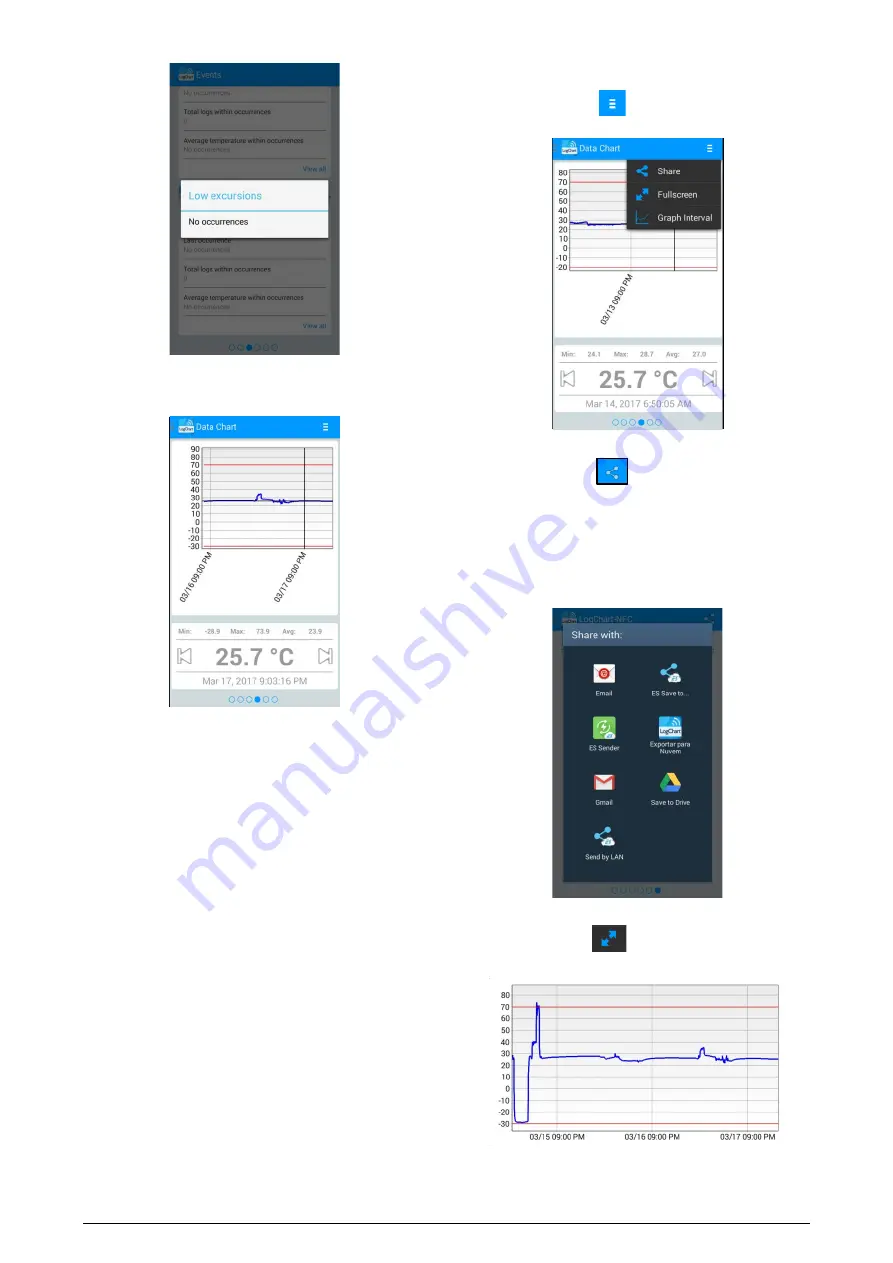
Fig. 12 – Low Excursions Message "No occurrences"
5.2.4
Data Chart Screen
Fig. 13 – Data Chart screen
In this screen, you can view the historical data in different time
intervals. You can also check the values that were in alarm,
maximum, minimum and the average value of temperatures.
By touching any location on the graph, you can see the temperature
value and the time of the record. To view the data for each record,
use the left or right arrows to select the previous or next record,
respectively.
When more than 2000 data are registered, the graph will show only
the last 2000. To select a graph display range, the "Chart range"
option can be used.
5.2.4.1
Data Chart Options Screen
When you select the icon
in the upper right of the screen, the
chart options will appear.
Fig. 14 – Data Chart Options screen
1.
By pressing the icon
, you can share the obtained data,
using the applications already installed in the smartphone, or
through the option of publishing in the NOVUS Cloud (you need
to have an account). To include the geographical location of the
data log in NOVUS Cloud, the GPS must be activated on the
smartphone.
The way in which the data will be shared is chosen in "Sharing
Options" in the Preferences screen.
Fig. 15 – Share screen
2.
"Full Screen" option
: With this option, the chart will be
displayed in full screen in landscape mode.
Fig. 16 – Full Screen Chart


