


32
NORTEK
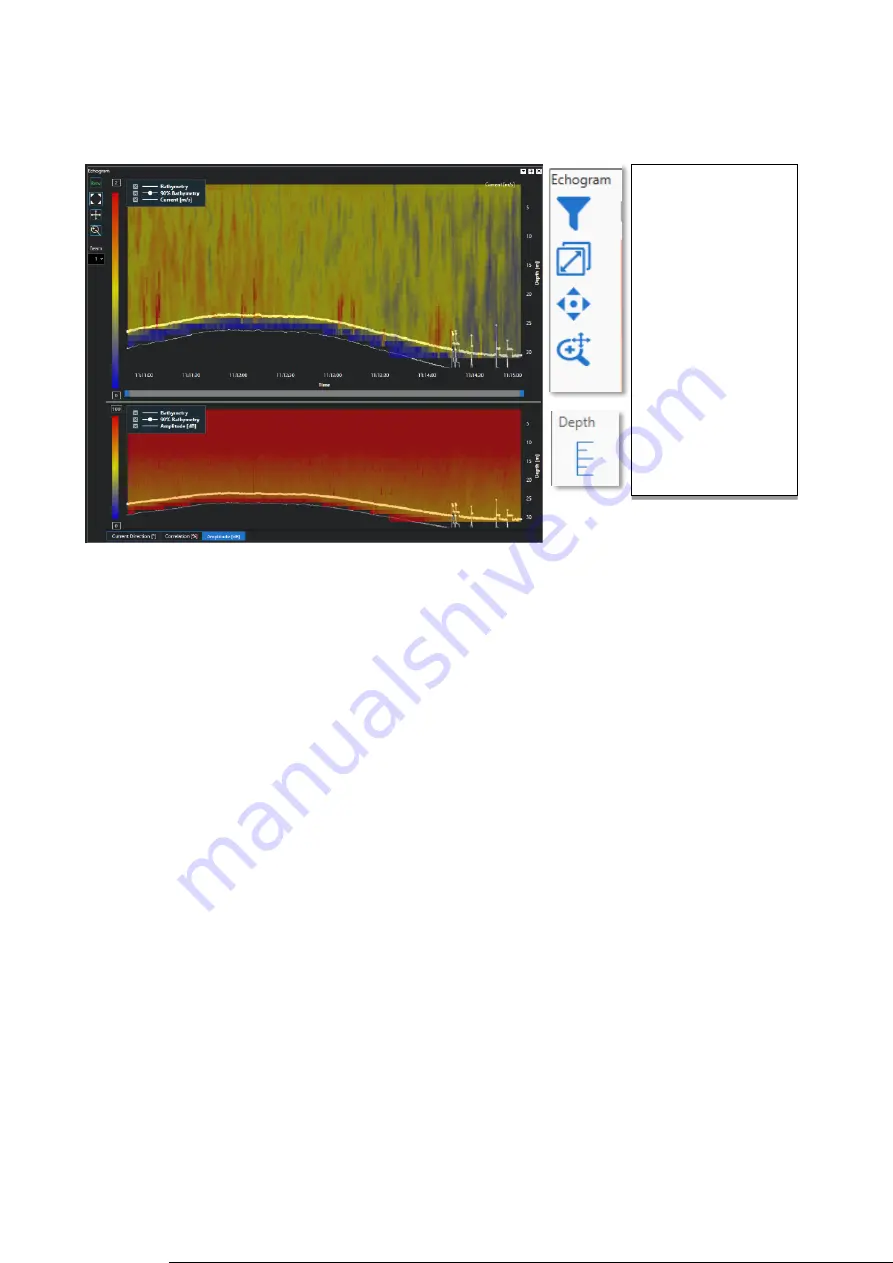
5.6 Echograms
Figure 25 Echograms with displaying options
The chart on top shows the magnitude (absolute value) of the current velocity. The lower chart can show
either ‘Direction’, ‘Correlation’ or ‘Amplitude’ for one of the four beams.
The ‘filter’ icon will show either all data up to the detected bottom , or all data for the maximum depth.
Default scaling for the vertical axis is automatic. The program tracks the bottom and adjusts the scaling so
all relevant data is in view. If you want to focus on a specific section or just want to see all, click the ‘Depth’
button. Now adjust the depth scale by clicking and dragging it with the mouse.
5.7 Keyboard Shortcuts
F1
Move between tabs in the Settings window
<Tab> and Arrow Keys Move between settings. Use Spacebar to toggle checkboxes
<Ctrl>-R
Reset bottomtrack. Re-Align the bottomtrack with the vessel position on the Map
+
Zoom in on the Map
-
Zoom out on the Map
<Ctrl> Arrow Keys
Pan the Map
5.8 Error Messages
Occasionally the system may show error messages after starting the Signature Sensor. These messages
are displayed as sent by the instrument and in general have the following structure:
NUM=n, STR=”<Error Message>”, LIM=”<Limits as exceeded>”
The ‘NUM’ is the numeric value of this error, ‘STR’ is the human readable description and ‘LIM’ are the limits
that were exceeded leading to the error. Usually the text will give the user a hint as to where or why the error
occurred.
The most common error is the following:
Remove data below
the bottom.
Zoom to extents
Toggle ‘Drag to Pan’
Zoom
Enable / Disable
manual vertical
scaling.


