background image

148

Affymetrix GeneChip

® 

 Genotyping  Analysis Software User’s Guide

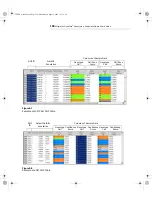
DM – CONFIDENCE SCORE

The DM Rank score is an indication of the probability that the SNP 
can be assigned to a particular genotype. The smaller the rank score, 
the larger the probability that the call is correct. Each SNP has a rank 
score for:

• AA  call

• AB call

• BB call

• No call

The Confidence score is the rank score for the genotype to which the 
SNP was assigned.

For more information about Dynamic Model Mapping Analysis see 

Appendix C, Dynamic Model Mapping Algorithm, page 335

BRLMM – CONFIDENCE SCORE

The BRLMM confidence score is the ratio of the distance to the nearest 
cluster to the distance of the second nearest cluster. DM and BRLMM 
confidence scores have no specific relationship to each other, other 
than the fact that their values are between 0 and 1 and the lower the 
value, the more confident the score.

For more information about the BRLMM Mapping Analysis see 

Appendix D, Bayesian Robust Linear Model with Mahalanobis (BRLMM) 
Distance Classifier Algorithm, page 353

.

GTYPE_manual.book  Page 148  Wednesday, August 2, 2006  11:31 AM

Summary of Contents for iServer MicroServer iTHX-M

Page 1: ...P N 702083 Rev 2 Affymetrix GeneChip Genotyping Analysis Software Version 4 1 User s Guide GTYPE Title page fm Page i Wednesday August 2 2006 12 15 PM...

Page 2: ...ou understand and agree that except as expressly set forth in the Affymetrix terms and conditions that no right or license to any patent or other intellectual property owned or licensable by Affymetri...

Page 3: ...GTYPE Overview 13 GTYPE ANALYSIS 13 USING GTYPE WITH GCOS 16 GTYPE WALKTHROUGH 19 MAPPING ANALYSIS WORKFLOW 28 UNIVERSAL TAG WORKFLOW 44 CHAPTER 2 Getting Started 49 OPTIONS FOR USING GTYPE 49 STARTIN...

Page 4: ...92 BOOKMARKS 98 DEFAULT IMAGE SETTINGS 101 CHAPTER 4 Analyzing Cell Intensity Data 107 OVERVIEW 107 USING THE ANALYZE DIALOG BOX 110 USING THE DATA TREE 114 USING THE BATCH ANALYSIS WINDOW 117 CHANGIN...

Page 5: ...AYS 193 CHECKING FOR MENDELIAN INHERITANCE ERROR 201 USING THE SAMPLE MISMATCH REPORT TOOL 208 EXPORTING DATA WITH THE SNP EXPORT TOOL 226 LOSS OF HETEROZYGOSITY ANALYSIS 247 CHAPTER 7 Universal Tag W...

Page 6: ...ANCED OPTIONS 285 CHAPTER 10 Reports 291 OVERVIEW 292 WORKING WITH REPORTS 299 Appendix A Installing GTYPE Software 307 OVERVIEW 307 REQUIREMENTS 307 INSTALLATION 308 SELECTING A DATABASE 313 INSTALLI...

Page 7: ...yesian Robust Linear Model with Mahalanobis BRLMM Distance Classifier Algorithm 355 INTRODUCTION 356 NORMALIZATION AND ALLELE SUMMARIZATION 359 CLUSTERING SPACE TRANSFORMATION 360 CALLING GENOTYPES 36...

Page 8: ...Tool Algorithms 379 SAMPLE MISMATCH ALGORITHM 379 FILTER ALGORITHMS 380 Appendix F IUPAC Base Codes 387 Appendix G File Types 391 Appendix H Working with Windowpanes Columns 395 Appendix I Hot Key De...

Page 9: ...Introduction GTYPE_manual book Page 1 Wednesday August 2 2006 11 31 AM...

Page 10: ...GTYPE_manual book Page 2 Wednesday August 2 2006 11 31 AM...

Page 11: ...of increased sample sizes for larger projects and increased file sizes for 500K analysis GTYPE 4 1 enhancements are designed to streamline data analysis for projects with thousands of samples GTYPE B...

Page 12: ...mage window Chapter 4 Analyzing Cell Intensity Data Describes how to analyze cell intensity data for Mapping and GenFlex Tag assays Chapter 5 Mapping Analysis Window Describes the analysis window that...

Page 13: ...er definable parameters Appendix D Bayesian Robust Linear Model with Mahalanobis BRLMM Distance Classifier Algorithm Describes the BRLMM mapping algorithm and the user definable parameters Appendix E...

Page 14: ...paragraph format For example 1 Click Yes to continue The Delete task proceeds In the lower right pane the status is displayed To view more information pertaining to the delete task right click Delete...

Page 15: ...ures depicted in this manual may not exactly match the windows displayed on your screen Information presented in Tips provide helpful advice or shortcuts for completing a task The Note format presents...

Page 16: ...e and is readable with the Adobe Acrobat Reader software available at no charge from Adobe at http www adobe com The GTYPE software includes on line help To access the on line help Click the Help butt...

Page 17: ...AFFYMETRIX UK Ltd Voyager Mercury Park Wycombe Lane Wooburn Green High Wycombe HP10 0HH United Kingdom UK and Others Tel 44 0 1628 552550 France Tel 0800919505 Germany Tel 01803001334 Fax 44 0 1628 5...

Page 18: ...10 Affymetrix GeneChip Genotyping Analysis Software User s Guide GTYPE_manual book Page 10 Wednesday August 2 2006 11 31 AM...

Page 19: ...Chapter 1 GTYPE Overview GTYPE_manual book Page 11 Wednesday August 2 2006 11 31 AM...

Page 20: ...Chapter 1 GTYPE_manual book Page 12 Wednesday August 2 2006 11 31 AM...

Page 21: ...Using GTYPE with GCOS see page 16 GTYPE Walkthrough see page 19 Mapping Analysis Workflow see page 28 Universal Tag Workflow see page 44 GTYPE Analysis In GTYPE 4 1 mapping analysis arrays are groupe...

Page 22: ...ss of Heterozygosity Analysis on page 247 10K MAPPING ARRAY The Affymetrix GeneChip Human Mapping 10K Array provides an efficient method for genotyping 10 000 SNPs in a single experiment Each SNP that...

Page 23: ...The Bayesian Robust Linear Model With Mahalanobis BRLMM distance classifier algorithm implements a model based algorithm to generate genotype calls from Affymetrix SNP microarrays BRLMM is a multi sa...

Page 24: ...analysis results are displayed in the GenFlex Tag window see Chapter 7 Universal Tag Window on page 253 You can export the analysis results in formats that other software applications can use Using GT...

Page 25: ...apping algorithm see Chapter 5 Mapping Analysis Window on page 139 GenFlex tag arrays tabular format only see Chapter 7 Universal Tag Window on page 253 Work with the mapping array data see Chapter 6...

Page 26: ...Tag Analysis data see Exporting Universal Tag Data on page 256 Cell intensity data from the Probe Intensity window see Exporting Cell Intensity Data on page 274 Reports see Copying a Report on page 3...

Page 27: ...nes Data tree Provides easy access to the experiment information cell intensity data and analysis results Shortcut Bar Provides quick alternatives to menu bar commands Figure 1 1 GTYPE user interface...

Page 28: ...s Log displays system status messages Selecting Different Data in the Data Tree Figure 1 2 Different data tree views GTYPE Project Name Sample Name Experiment Information Cell Intensity Data Analysis...

Page 29: ...r Project and Sample Information Figure 1 3 Data tree functions for Project and Sample information Rename a sample or project Right click the Project or Sample file to view the shortcut menu GTYPE_man...

Page 30: ...iment Information Figure 1 4 Data tree functions for experiment information GTYPE View information about the experiment Right click the Experiment information file to view the shortcut menu Open an ex...

Page 31: ...analysis results in Create a Mapping Analysis report rpt for the selected analysis results files View information about the analysis results file Right click the selected analysis results files to vi...

Page 32: ...s Results Figure 1 6 Data tree functions for Universal Tag analysis results Display analysis results in the Universal Tag window View information about the analysis results file Right click the select...

Page 33: ...alog box to create a new FileSet Rename the selected FileSet Delete the selected FileSet Right click the FileSets header to view the shortcut menu Right click a FileSet to view the shortcut menu Open...

Page 34: ...are User s Guide Tools Shortcut Bar For detailed information see Shortcut Bar Tools on page 73 Figure 1 8 GTYPE Shortcut bar Tools Click a button to change the view in the main display area GTYPE_manu...

Page 35: ...YPE Shortcut bar Settings Change defaults for image settings servers and analys Click a button to Select categories of data for display in the data tree Change the MPAM and Dynamic Model Mapping algor...

Page 36: ...3 Pedigree test Figure 1 17 Sample Mismatch test SNP Export Figure 1 24 Analyze the cell intensity data to generate genotype calls and confidence scores or call zone scores Figure 1 11 View the analys...

Page 37: ...emplate with attributes for pedigree data in GCOS Manager Use this template when registering the mapping samples and experiments in GCOS Create a text file with the attribute information in the proper...

Page 38: ...alysis shortcut bar button Drag the cell intensity data for analysis to the Batch Analysis Window 2 To run the analysis click the Run Analysis toolbar button 3 The Mapping algorithm report is automati...

Page 39: ...You can use the VirtualSet Tool to group arrays based on common sample groups This is done in two main steps A Create a VirtualSet Definition B Use the VirtualSet definition to group arrays into virt...

Page 40: ...ree 2 Right click on the selected data and select Open from the short cut menu 3 Select a VirtualSet definition from the list and click OK The analysis window displays the data for each virtual array...

Page 41: ...ysis window Figure 1 15 BRLMM Analysis Window displays SNP table only Figure 1 14 Viewing Dynamic Model Mapping Analysis results The Dynamic Model Mapping Analysis window displays the results in the D...

Page 42: ...15 Viewing MPAM Mapping Analysis results The MPAM Mapping Analysis window displays the results in the RAS scatter plot and the MPAM SNP table For more information see Chapter 5 Mapping Analysis Windo...

Page 43: ...Viewing cell intensity data for SNP probe sets Click the Probe Intensity button to evaluate probe cell intensities for a selected SNP in the Probe Intensity Window For more information see Chapter 8 P...

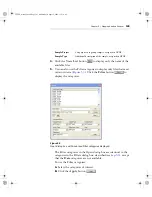
Page 44: ...t for errors in Mendelian inheritance To perform a pedigree check 1 Select Tools Pedigree Check from the menu bar or Click the Pedigree Check button in the Shortcut bar The Pedigree Check dialog box o...

Page 45: ...sults SNPs that do not meet Mendelian inheritance rules are displayed in a text file that can be viewed in spreadsheet software For more information see Checking for Mendelian Inheritance Error on pag...

Page 46: ...from the data tree 4 Enter a name and directory for the file 5 Click Report To perform a Sample Match check 1 Select Tools Sample Mismatch Report from the menu bar or Click the Sample Mismatch Report...

Page 47: ...splayed in a report that can be viewed in Notepad or spreadsheet software The Sample Match report displays a list of CHP file pairs with the same SNP pattern different samples from the same person For...

Page 48: ...and mislabeled samples 2 Drag and drop analysis data from the data tree 5 Enter a name and directory for the file 6 Click Report To perform a Sample Mismatch check 1 Select Tools Sample Mismatch Repor...

Page 49: ...rt are displayed in a report that can be viewed in Notepad or spreadsheet software Depending upon the attribute information you provide the Sample Mismatch report displays A list of CHP file pairs wit...

Page 50: ...g box opens 4 Select parameters for filtering SNPs from the output optional 3 Drag and drop analysis data from the data tree You can group files from different assay types with Virtual Sets optional 5...

Page 51: ...xport dialog box opens For more information see Exporting Data for Association and Linkage Analysis Software on page 237 3 Select the sample attributes with the pedigree information needed by the link...

Page 52: ...port the analysis results Figure 1 26 Figure 1 25 Analyzing Universal Tag data 2 Select Analyze from the menu 1 Right click on selected cell intensity data files in the data tree 3 Enter a name for th...

Page 53: ...In the data tree double click the analysis results that you want to view 5 In the Tag table copy and paste selected rows to the system clipboard for export to tabular format For more information see...

Page 54: ...46 Affymetrix GeneChip Genotyping Analysis Software User s Guide GTYPE_manual book Page 46 Wednesday August 2 2006 11 31 AM...

Page 55: ...Chapter 2 Getting Started GTYPE_manual book Page 47 Wednesday August 2 2006 11 31 AM...

Page 56: ...Chapter 2 GTYPE_manual book Page 48 Wednesday August 2 2006 11 31 AM...

Page 57: ...e installed on your computer see Using GTYPE with a Local GCOS Database below A remote process database from a GCOS Server on a network see Using GTYPE with GCOS Server USING GTYPE WITH A LOCAL GCOS D...

Page 58: ...GTYPE Server components must be installed on GCOS Server to use GTYPE with GCOS Server For more information see Installing GTYPE Server Components in GCOS Server on page 314 The GTYPE Server component...

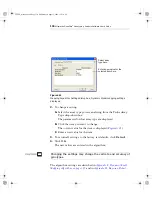
Page 59: ...log Figure 2 1 2 To switch from a local to a remote GCOS Server database A Select Tools Defaults from the menu bar Figure 2 1 GTYPE user interface at start up Depending upon your system you may use GT...

Page 60: ...ly Opened Images on page 85 Analysis Defaults on page 135 C Check the GCOS Server checkbox D Click OK to close the Defaults dialog box Figure 2 2 Defaults dialog box Database Options tab You are not a...

Page 61: ...ck OK to close the Filters dialog box The data tree displays the data for the selected assay type Figure 2 3 GTYPE Filters dialog box You can also use the Filters dialog box to display data that match...

Page 62: ...the selected Assay type see Data Tree on page 57 Use the data tree to View Project Sample Experiment and FileSet Information Select cell intensity data for analysis Select cell intensity data or anal...

Page 63: ...ports see Chapter 10 Reports on page 291 Shortcut bar Tools View Click the buttons to switch between open windows in the main display area or to open Batch Analysis and Probe Intensity windows For mor...

Page 64: ...tions Menu Bar Command Toolbar Button Function File Open Displays the Open dialog box so that a file for example analysis results or cell intensity data may be opened File Save Saves the open image ex...

Page 65: ...orms analysis on displayed cell intensity data in the Image window Disabled unless cell intensity data is displayed in the Image window Tools Defaults Image Settings all cell intensity files Displays...

Page 66: ...Viewing File Information on page 62 Open data for viewing see Opening Cell Intensity or Analysis Results Data on page 67 Select cell intensity data for analysis see Using the Data Tree on page 114 Sel...

Page 67: ...priate option from the menu Classic View The Classic view displays the data organized by data type Experiment data files with exp extension Intensity data files with cel extension Analysis Results dat...

Page 68: ...ge the Assay type 1 Select Tools Filters from the menu bar The Filters dialog box opens 2 Select the assay type from the Assay Type drop down box 3 Select the other categories you are interested in de...

Page 69: ...and collapse tree components To expand or collapse a tree component Click the button or right click the item and select the appropriate option from the shortcut menu To hide a project altogether Right...

Page 70: ...select Information from the shortcut menu Information about the selected item s is displayed Figure 2 7 USING FILESETS File sets allow you to create custom groups of GTYPE files Figure 2 8 They also a...

Page 71: ...r any process where you need to select a file for functions like Batch Analysis Displaying analysis results SNP Export Pedigree Check Sample Mismatch Report Figure 2 8 FileSets in GTYPE Data Tree GTYP...

Page 72: ...ick the FileSets header in the Data Tree and select New FileSet from the shortcut menu Or from the main menu select Tools File Sets The FileSets dialog box opens Figure 2 10 Figure 2 9 FileSets header...

Page 73: ...4 Enter a name in the FileSet Name box 5 Click Save to create the FileSet The FileSet appears in the Data Tree under the FileSets heading To edit a fileset 1 Right click the FileSet in the data tree a...

Page 74: ...elect Rename FileSet from the shortcut menu 2 The Rename FileSet dialog box appears Figure 2 12 3 Enter a new name in the New Name box and click OK The fileset is renamed To delete a fileset 1 Right c...

Page 75: ...ty data is displayed in an Image window For more information see Chapter 3 Working with Images on page 77 MPAM DM and BRLMM mapping analysis results are displayed in the mapping analysis window For mo...

Page 76: ...Data of Type drop down list 3 Select the experiment of interest in the Experiments list 4 Click the OK button The main display area displays information about the selected experiment in the Experiment...

Page 77: ...tem whose name you wish to change 2 Select the appropriate rename option from the shortcut menu The appropriate Rename dialog box opens Figure 2 16 Figure 2 15 Experiments window The Experiment window...

Page 78: ...d item is renamed OPENING A REPORT GTYPE generates algorithm and SNP reports providing additional information about mapping analysis To open a report 1 Click the Open button in the Main toolbar The Op...

Page 79: ...iew or select multiple reports and click Open The report is displayed 4 If multiple reports are open click the Reports button in the Shortcut Bar Tools menu to view the next report For more informatio...

Page 80: ...page 76 To hide or display the shortcut bar Click the Shortcuts button on the Main toolbar To toggle between the two shortcut bar sections Click Tools or Settings in the shortcut bar The buttons in t...

Page 81: ...ile Sets Virtual Sets SNP Export Pedigree Check Sample Mismatch Report BRLMM Batch Analysis Batch Analysis AttributeImporter Tool Probe Intensity Publish Tool When MPAM DM or BRLMM files are open the...

Page 82: ...half Displays experiment information Displays an open cell intensity image Displays the FileSet Tool Opens the Virtual Set Definition window Opens the SNP Export tool Opens the Pedigree Check tool Ope...

Page 83: ...the Add Cell Files dialog box to select data to display in the Probe Intensity window or display an open Probe Intensity window Displays an open Universal Tag window Displays an open Dynamic Modeling...

Page 84: ...the shortcut menu To mute the error message sound right click the status log and remove the check mark from the Play Error Sound option To hide or display the status log click the Status Log button i...

Page 85: ...Chapter 3 Working with Images GTYPE_manual book Page 77 Wednesday August 2 2006 11 31 AM...

Page 86: ...Chapter 3 GTYPE_manual book Page 78 Wednesday August 2 2006 11 31 AM...

Page 87: ...he cell intensity data file with a cel extension GTYPE analyzes the cell intensity data and saves the results to an analysis results file with a chp extension The Image window displays the cell intens...

Page 88: ...s Software User s Guide Each cell intensity data file is displayed in an Image window Figure 3 2 Figure 3 1 Drag cell intensity files to the main display area GTYPE Main display area GTYPE_manual book...

Page 89: ...2 To navigate the image use the scroll bars at the bottom and right side of the Image window 3 To display an overlapping cascade of the open images select Window Cascade from the menu bar To display t...

Page 90: ...82 Affymetrix GeneChip Genotyping Analysis Software User s Guide Figure 3 3 Cell intensity images cascade view top tiled view bottom GTYPE_manual book Page 82 Wednesday August 2 2006 11 31 AM...

Page 91: ...t corner Select View Corner from the menu bar and choose the corner you want to view Auto Automatically scales the intensity of the current image based on the range of intensity levels in a selected r...

Page 92: ...ting Color Settings see page 86 Specifying Highlight Colors see page 88 MAKING ADJUSTMENTS TO THE CURRENT IMAGE ONLY To adjust the settings for the current image only do one of the following Click the...

Page 93: ...ettings tab of the Defaults dialog box Figure 3 4 Figure 3 4 Image Settings dialog box for the active file left Defaults dialog box Image Settings tab for global settings right The settings specified...

Page 94: ...cale option in the Image Settings dialog box Figure 3 4 2 Click OK to automatically scale the image When the Image Settings dialog box is reopened it displays the minimum and maximum pixel intensities...

Page 95: ...e or pseudo color bar at the top of the Image window Color Bar option Table 3 1 Color options for cell intensity data To Display In the Image Settings or Defaults dialog box choose the GTYPE_manual bo...

Page 96: ...ghlights in the Image Settings or Defaults dialog box Figure 3 4 The Highlight Colors dialog box opens Figure 3 5 2 To change the color of a particular item for example the grid overlay A Click the as...

Page 97: ...palette Viewing Probe Cell Data You can click a probe cell feature in the cell intensity data to view information about the feature and the associated probe 1 To display probe cell data do one of the...

Page 98: ...probe cell data is updarted PROBE CELL DATA MAPPING ARRAYS The following information is displayed for a mapping assay probe cell Figure 3 7 Probe cell data MPAM Model Analysis array Cell X The probe...

Page 99: ...tion Specifies a probe pair in the probe set Tile Identifier for the probe set Figure 3 8 Probe cell data GenFlex Tag Array Cell Coordinates The probe cell x and y coordinates in cell units Intensity...

Page 100: ...er see page 94 Viewing Probe Cell Data for a Highlighted Probe Set see page 96 SELECTING PROBE SETS BY NAME You can choose by name the probe sets that you want to highlight 1 Right click the cell inte...

Page 101: ...be set that you want to highlight in the image and click Apply To select more than one probe set press and hold the Ctrl key while you click the names The selected probe set s is highlighted in the ce...

Page 102: ...want to highlight by position and tile number 1 Right click the cell intensity data and select View Probe Tiling in the shortcut menu or select View Probe Tiling from the menu bar The View Probe Tili...

Page 103: ...probe sets Choose Tile Number and enter a number in the drop down list to highlight the selected position s in the selected tile There are different position and tile options for Mapping Arrays GenFle...

Page 104: ...set VIEWING PROBE CELL DATA FOR A HIGHLIGHTED PROBE SET 1 In the cell intensity image click a highlighted probe cell of interest The red cross hairs are placed over the feature 2 Right click and selec...

Page 105: ...do one of the following Right click the image and select View Next Highlight in the shortcut menu Select View Next Highlight from the menu bar If it is open the Probe Cell Data dialog box is automatic...

Page 106: ...marks A bookmark denotes a specific area of the cell intensity image at a particular magnification level Bookmarks make it easy to quickly view the intensity data at a specific location in different i...

Page 107: ...a name in the Bookmark Name box or use the default name Bookmark 1 2 3 4 Click OK to create the bookmark VIEWING A BOOKMARK IN AN IMAGE To select a bookmark Right click the image and select View Book...

Page 108: ...e menu bar The Edit Bookmarks dialog box opens Figure 3 14 2 Select the bookmark name that you want to edit then click a command Figure 3 14 Edit Bookmarks dialog box Delete Permanently removes the se...

Page 109: ...y see page 102 Displaying the Grid Overlay see page 104 VIEWING DEFAULT SETTINGS To view the default settings select Tools Defaults from the menu bar The Defaults dialog box opens Figure 3 15 The imag...

Page 110: ...efaults dialog box Figure 3 15 and click OK In the Image Settings dialog box for the current cell intensity data file you can click Defaults to return the intensity parameters Autoscale option and Int...

Page 111: ...Defaults dialog box Figure 3 15 The Highlight Colors dialog box opens Figure 3 16 2 To change the color of a particular item for example the grid overlay A Click the associated color box in the Highl...

Page 112: ...ale to the right When finished click Add to Custom Colors to apply the color D Click OK to close the Color palette DISPLAYING THE GRID OVERLAY Choose the Grid Overlay option Figure 3 15 to automatical...

Page 113: ...Chapter 4 Analyzing Cell Intensity Data GTYPE_manual book Page 105 Wednesday August 2 2006 11 31 AM...

Page 114: ...Chapter 4 GTYPE_manual book Page 106 Wednesday August 2 2006 11 31 AM...

Page 115: ...ip Human Mapping 100K Array Set or the GeneChip Human Mapping 500K Array Set see page 109 GenFlex Tag see page 110 The analysis produces an output file with a chp file extension for each sample These...

Page 116: ...apping analyses only see page 117 4 Assign names to the generated analysis results files and report files optional If you don t assign new names to the analysis results and reports previously created...

Page 117: ...ffymetrix GeneChip Human Mapping 100K Array Set or the GeneChip Human Mapping 500K Array Set the QC analysis is performed using the Dynamic Model DM mapping algorithm or the Bayesian Robust Linear Mod...

Page 118: ...iles for analysis To select cell intensity data and run an analysis using the Analyze dialog box 1 Select the assay type using the Filters dialog box see page 53 2 Make any desired changes to the algo...

Page 119: ...able files You can also use the Filter categories to display only files that meet certain criteria Figure 4 2 Figure 4 1 Analyze dialog box Data Name Unique file identifier Sample Name Identifier for...

Page 120: ...to display the categories B Select the categories of interest C Click the Apply button The cell intensity data that matches the selected categories is displayed in the dialog box 4 Select the data of...

Page 121: ...n 5 Click OK to continue the analysis MPAM and DM only If you selected only one file The Save Results As dialog box Figure 4 3 opens if chosen as a default option See Analysis Defaults on page 135 6 C...

Page 122: ...tree 1 Select the assay type using the Filters dialog box see page 53 2 Make any desired changes to the algorithm parameters see page 128 If you don t want to overwrite previously generated analysis...

Page 123: ...file extension If you selected more than one file the algorithm report is assigned the name of the first cell intensity data file in the list and given the rpt file extension 4 Click OK to continue th...

Page 124: ...can be displayed in the Report window see Chapter 10 Reports on page 291 Figure 4 6 Overwrite warning dialog box If you don t want to overwrite previously generated analysis results files or algorith...

Page 125: ...ty data files as a text file that can be subsequently imported to the Batch analysis window and analyzed see page 126 There are two mapping analysis windows one for MPAM and DM and one for BRLMM Make...

Page 126: ...the Batch Analysis window Click the appropriate Batch Analysis shortcut button or or Select Run Batch Analysis from the menu bar The Batch Analysis window opens Figure 4 8 Figure 4 8 Batch Analysis wi...

Page 127: ...nctions Menu Bar Command Toolbar Button Function Edit Add Item Displays the Add dialog box to select and add cell intensity data to the Batch Analysis window see page 120 Edit Remove Item Removes sele...

Page 128: ...ntensity data files to the Batch Analysis window Using the data tree A In the data tree select the cell intensity data files that you want to analyze Figure 4 8 B Drag the selection to the Batch Analy...

Page 129: ...he cell intensity data files that you want to analyze and click Open The Batch Analysis window displays the selected data files and the analysis results files and report file that will be generated Th...

Page 130: ...analysis results file or a report file in red if a previous version will be overwritten If you do not want to overwrite the previous results or report rename the file For more information see Renamin...

Page 131: ...p an analysis click the Stop button RENAMING RESULTS If you want to analyze cell intensity data and do not want to overwrite existing analysis results files rename the analysis results files before yo...

Page 132: ...matically added to the cell file names To automatically add a prefix and or suffix to analysis results file names 1 In the Batch Analysis window click the Options button or Select View Options from th...

Page 133: ...he shortcut menu or select Edit Set Prefix Suffix from the menu bar The Set Prefix Suffix dialog box opens Figure 4 14 3 Enter a prefix and or a suffix 4 Click OK The prefix and or suffix is added to...

Page 134: ...click the report name with the rpt extension or select Edit Rename Report File from the menu bar 2 Edit the report file name FILE LISTS The contents of the Batch Analysis window can be exported to a...

Page 135: ...for the file list txt and click Save Importing a File List To import a file list 1 Click the Batch Analysis shortcut button or to open the Batch Analysis window 2 Select Edit Import File List from the...

Page 136: ...lysis results files and reports in the file list including the file pathways are added to the Batch Analysis window Changing Algorithm Settings You can make adjustments to certain settings for the fol...

Page 137: ...A Select the array type you are analyzing from the Probe Array Type drop down box For best performance you should assign a gender to the sample when registering the experiment and enter values for ge...

Page 138: ...g Software GCOS You can then define these gender attribute values in GTYPE so GTYPE can use the appropriate male or female model for the sex chromosomes If the gender attribute is not set or not found...

Page 139: ...experiments Figure 4 18 2 In GCOS assign an attribute value to each sample you analyze Figure 4 19 Other attribute data can be imported into GTYPE and used for different analyses for more information...

Page 140: ...HM SETTINGS To view the user modifiable algorithm settings 1 Click the Mapping Algorithm Settings button in the Settings shortcut bar or Select Tools Mapping Algorithm Settings from the menu bar The M...

Page 141: ...s click Default 4 Click OK The new values are entered in the algorithm The algorithm settings are described in Dynamic Model Mapping Algorithm Settings on page 351 BRLMM MAPPING ALGORITHM SETTINGS To...

Page 142: ...3 To return all settings to the factory set defaults click Default 4 Click OK The new values are entered in the algorithm The algorithm settings are described in Appendix C Dynamic Model Mapping Algo...

Page 143: ...ATA NAME To display a Save Results As dialog box at the start of an analysis Select the Prompt for output data name option Figure 4 22 The Save Results As dialog box opens if you select one file for a...

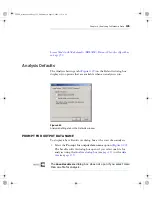
Page 144: ...s Guide DISPLAY SETTINGS WHEN ANALYZING DATA Choose the Display settings when analyzing data option to display the appropriate Algorithm Settings dialog box at the start of an analysis Figure 4 22 GT...

Page 145: ...Chapter 5 Mapping Analysis Window GTYPE_manual book Page 137 Wednesday August 2 2006 11 31 AM...

Page 146: ...Chapter 5 GTYPE_manual book Page 138 Wednesday August 2 2006 11 31 AM...

Page 147: ...ftware analyzes this array data by using one of the following tools Modified Partitioning Around Medoids MPAM Mapping Analysis Tool with the Affymetrix GeneChip Human Mapping 10K Array see page 14 Dyn...

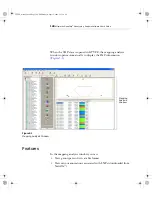
Page 148: ...s automatically to display the SNP information Figure 5 1 Features In the mapping analysis window you can View genotype results in a table format View various annotations associated with SNPs download...

Page 149: ...g Results in the Mapping Analysis Window After sample analysis see Analyzing Cell Intensity Data on page 105 you can view the data files in the GTYPE mapping analysis window To open analyzed sample da...

Page 150: ...ysis results using the Open Dialog box 1 Click the Open button or Select File Open from the menu bar The Open dialog box appears Figure 5 2 2 Select CHP Data chp or brlmm chp from the Data of Type dro...

Page 151: ...Open dialog box are identical to the categories in the Filters dialog box described see page 60 except that the Date categories are not available To use the Filter categories A Select the categories...

Page 152: ...and click OK The window displays the selected results Figure 5 4 in the mapping analysis window MAPPING ANALYSIS WINDOW TOOLBAR The toolbar provides quick access to some of the commonly used functions...

Page 153: ...pies a highlighted selection in the table to the system clipboard see page 162 Back Selects the Previous SNP in the SNP Table Forward Selects the Next SNP in the SNP Table Edit Find Opens the Find dia...

Page 154: ...obtained from perfect match cells for the A and B alleles of a SNP on a scale of 0 to 1 such that BB alleles have RAS values closer to 0 AA alleles have RAS values closer to 1 AB alleles have RAS valu...

Page 155: ...zone score for an allele s medoid is less than a predefined quantity known as the call zone radius or call zone bound default value 0 8 the sample is assigned that allele call A call zone score near...

Page 156: ...out Dynamic Model Mapping Analysis see Appendix C Dynamic Model Mapping Algorithm page 335 BRLMM CONFIDENCE SCORE The BRLMM confidence score is the ratio of the distance to the nearest cluster to the...

Page 157: ...he SNP ID chromosome number physical location and database ID The SNP call genotype that was determined by the algorithm The Call Zone score for MPAM Figure 5 12 the Confidence score rank score for th...

Page 158: ...M SNP Table SNP ID NetAffx Annotation Columns of Sample Data Call Zone Score Genotype Call Call Zone Score Genotype Call SNP ID Default NetAffx Annotation Columns of Sample Data Confidence Score Genot...

Page 159: ...re see page 159 Print the table contents Select a SNP or Assay to display an MPAM or DM Scatter Plot see page 170 Drill down to view cell intensity data for a selected SNP in the Probe Intensity windo...

Page 160: ...Confidence Score DM and BRLMM or Call Zone Score MPAM are displayed in the table You can display other columns by selecting the options on the Table tab in the Mapping Analysis Options box View Option...

Page 161: ...apping Analysis Window you will be prompted to download a set of default NetAffx annotations Using the NetAffx Annotation Display Dialog Box on page 279 You can select additional NetAffx annotations f...

Page 162: ...to the default values Figure 5 12 Display tab showing DM values The first time you choose to display data for an array type in the mapping analysis window you will be prompted to download a set of de...

Page 163: ...romosomal position for the SNP NetAffx annotation TSC_ID The SNP Consortium ID NetAffx annotation Call The SNP genotype call for the sample Call Zone MPAM only Call Zone Score also known as the Distan...

Page 164: ...columns of a particular data type 1 Click the Options button The Mapping Analysis Options dialog box opens Figure 5 13 2 Click the Tables tab 3 Select the data columns you wish to display from the li...

Page 165: ...nu Multiple Column Table Sort You can sequentially sort the table using up to four data columns with the Sort dialog box 1 Right click the table and select Sort from the shortcut menu or Select Edit S...

Page 166: ...he Ascending or Descending sort order 4 To specify another sort repeat step 3 5 Click OK The table is arranged using the specified sorts SEARCHING THE SNP TABLE To perform a text search on the cells i...

Page 167: ...for further analysis in other applications by Exporting data as a tab formatted file see page 160 Copying selected cell contents directly to the Clipboard see page 162 Figure 5 16 Find dialog box If t...

Page 168: ...to export all rows and columns make no selection in the table 2 Select Export Table from the menu bar The Export As dialog box opens Figure 5 17 You can also export mapping analysis data in formats th...

Page 169: ...er a name for the txt file 5 Select a file type from the Save as type dropdown list Text Files txt Microsoft Excel Files xls 6 Choose a Save Option Export All exports the entire contents of the table...

Page 170: ...left corner of the table Figure 5 18 To select part of the table Do one of the following Use the click and drag method to select the rows Click a row or column header to select the row or column To se...

Page 171: ...ar The selected table cells are copied to the system clipboard PRINTING THE SNP TABLE CONTENTS To print the table contents 1 Select the contents you wish to print in the table 2 Click the Print button...

Page 172: ...p half of the mapping analysis window when you open a CHP file for either MPAM or DM Each plot is described in detail below MPAM SCATTER PLOT When you open a CHP file resulting from MPAM analysis the...

Page 173: ...Chapter 5 Mapping Analysis Window 165 Figure 5 20 MPAM scatter plot in the mapping analysis window Tool Bar RAS Scatter Plot SNP Table GTYPE_manual book Page 165 Wednesday August 2 2006 11 31 AM...

Page 174: ...e X axis RAS1 Antisense strand RAS values on the Y axis RAS2 For the selected SNP the SNP s model medoid and call zone radius for the three allele calls are displayed in different colors A plot of the...

Page 175: ...aluated to determine the gender of the sample and the SNPs on the X chromosome are then called again using the appropriate gender specific model The calls for X chromosome SNPs displayed in the Scatte...

Page 176: ...er Plot Figure 5 23 provides a quick way to compare the confidence level of the SNP calls for different samples It displays the rank scores for all calls in a triangular scatter plot with the AA AB an...

Page 177: ...24 Sample name Plot coordinates AA AB BB rank scores Call genotype with the lowest rank score Confidence score rank score for the genotype call For more information about the transformations used to...

Page 178: ...SNP s row in the table You can also step sequentially through the SNPs by using the Step Up or Step Down buttons PRINTING THE SCATTER PLOT To print the Scatter Plot 1 Click the Print button or Select...

Page 179: ...mber of copies etc depending upon your system and printer 2 In the Print Range section select the Graph checkbox 3 Click OK The Scatter Plot prints Figure 5 25 Print dialog box You can also print out...

Page 180: ...hreshold DM value displayed Display highlighted features only Control the display of the different allele calls Color Style Size To show the Display tab 1 Click the Options button The Mapping Analysis...

Page 181: ...is option is useful if you have performed a mapping analysis after changing the CallZoneBound parameter for more information see MPAM Mapping Algorithm Settings on page 331 To control the display of c...

Page 182: ...ally change the position of the line within the plot when you change the threshold the positions of the points change instead This option is useful if you have performed a mapping analysis after chang...

Page 183: ...for unhighlighted samples using the Show Highlight Only checkbox Controlling the Display of Call Types The Call Types menu Figure 5 28 allows you to change the colors shapes and sizes of the symbols...

Page 184: ...display of call types 1 Click the color swatch for the feature you want to change The color palette opens Figure 5 28 Call Types menu Figure 5 29 Color palette custom color field displayed Luminosity...

Page 185: ...or field Adjust the color brightness using the luminosity scale to the right When finished click Add to Custom Colors to apply the color C Click OK to close the Color palette 2 Select a style from the...

Page 186: ...178 Affymetrix GeneChip Genotyping Analysis Software User s Guide GTYPE_manual book Page 178 Wednesday August 2 2006 11 31 AM...

Page 187: ...Chapter 6 Working with Mapping Data GTYPE_manual book Page 179 Wednesday August 2 2006 11 31 AM...

Page 188: ...Chapter 6 GTYPE_manual book Page 180 Wednesday August 2 2006 11 31 AM...

Page 189: ...delian error checking with the Pedigree Check tool see page 201 Check the data for incorrectly labeled samples and other problems with the Sample Mismatch report tool see page 208 Export data for use...

Page 190: ...the mapping samples and experiments in GCOS see page 184 CREATING SAMPLE TEMPLATES WITH ATTRIBUTES A variety of types of information can be associated with a sample in the GCOS Process Database This...

Page 191: ...e Type String Integer Float Controlled Date Time Whether the attribute is required to register a sample The values that can be used for a controlled attribute The following templates are provided with...

Page 192: ...s LINKING SAMPLES TO TEMPLATES The sample template is then used when you register a sample and experiment in GCOS Figure 6 2 The Experiments window provides a convenient way to review the sample attri...

Page 193: ...e used To group arrays into virtual arrays To perform Mendelian Inheritance checking To perform sample mismatch checks For export with genotype data in formats that can be used by association and link...

Page 194: ...he column headers to attribute fields in AttributeImporter Tool see Figure 6 6 The remaining rows provide information for the samples one sample per row The row contains one or more columns containing...

Page 195: ...allows you to Select the data file for import Select the attributes in the data file Select options for the import 2 Click Browse The Open dialog box opens Figure 6 5 Figure 6 4 AttributeImporter Tool...

Page 196: ...g box toolbar to locate and select the data file B Click Open The path and data file name appear in the textbox The attributes and their column assignments appear in the table Figure 6 6 Figure 6 5 Se...

Page 197: ...mported for the samples by clicking in the associated checkbox Figure 6 6 AttributeImporter Tool with attributes displayed Header Labels Header for a column in the sample data file cannot be edited At...

Page 198: ...the Attributes in Default Template box For GCOS Server mode only templates for which the user has Read privileges are displayed in the Default Template edit box 7 Select a project for the new placehol...

Page 199: ...ignore the missing attribute When the import is finished a notification box opens giving information about the samples created and modified Figure 6 8 The AttributeImporter Tool creates a log file wi...

Page 200: ...s reported for every sample processed Whether the sample was modified or created Exceptions encountered during the import Exceptions shall include missing attribute and improper data types Summary des...

Page 201: ...rtual Arrays The VirtualSet tool allows you to group arrays based on common sample attributes the data for a resulting group can be displayed in one column of the SNP table in the mapping analysis win...

Page 202: ...be used as a single attribute for this purpose or the pedigree identifiers Family ID and Person ID Multiple IDs could be used to specify a particular person The SampleName uniquely identifies every s...

Page 203: ...finition dialog box by doing one of the following A Select multiple mapping analysis data from different arrays in the data tree see page 141 or Open dialog box see page 142 The VirtualSet Creation di...

Page 204: ...opens Figure 6 13 The dialog box is divided into the following sections Specify VirtualSet Name see below Select attributes uniquely identifying a sample see page 197 Select arrays to combine into si...

Page 205: ...name of the virtual array set The virtual set name can be selected from previously saved sets or a new name can be entered Figure 6 15 Step 2 Select attributes uniquely determining a sample Template D...

Page 206: ...utes list and click the Add button The attributes are displayed in the Unique Attributes box You can remove attributes by selecting them and clicking the Remove button You can remove all selected attr...

Page 207: ...t data for display in a virtual array set 1 Select multiple mapping analysis data from different arrays in the data tree see page 141 or Open dialog box see page 142 The VirtualSet Creation dialog box...

Page 208: ...the offending files These duplicate sample files are ignored and Virtual Sets are created only for samples without duplication If a probeset is duplicated on multiple arrays the same probeset name ap...

Page 209: ...trio that did not follow Mendelian inheritance rules The pedigree check is described in the following sections Running the Pedigree Check see below Pedigree Report see page 206 RUNNING THE PEDIGREE C...

Page 210: ...ed into the following sections Specify sample attribute containing pedigree information see page 202 Select samples for pedigree check report see page 204 Specify output file name see page 205 2 Speci...

Page 211: ...attributes in the selected sample template Person Unique identifier for the person from whom the sample was taken Family ID Unique identifier for the family Father Unique identifier for the father Th...

Page 212: ...amily box D Select the attribute used to identify the father and click the Add button for the Father box E Select the attribute used to identify the mother and click the Add button for the Mother box...

Page 213: ...ou specify a directory and name for the pedigree check report Figure 6 22 6 Enter the report name and path in the Report File Name textbox or click the Browse button The Save As dialog box opens Figur...

Page 214: ...pear in the textbox D Click Report to run the pedigree check The Pedigree Check report appears in the selected directory see Pedigree Report below PEDIGREE REPORT The Pedigree report Figure 6 24 is a...

Page 215: ...fier assigned to the SNP by Affymetrix Family Family ID A pedigree family can consist multiple generations of grandparents parents and children Each pedigree is assigned a unique ID FatherID Identifie...

Page 216: ...ure of the number of alleles shared by Figure 6 25 Family Summary information Sample ID Unique identifier assigned to the person from whom the sample was taken SNP Errors for the sample The total numb...

Page 217: ...on see Checking for Sample Matches on page 210 If sample attributes are specified the sample mismatches are also reported The report can flag the following types of problems chp files with the same sa...

Page 218: ...run a sample match report 1 Open the Sample Mismatch Report dialog box Perform the following steps in the dialog box Drag and drop chp files from the Data Tree see below Specify the mismatch threshol...

Page 219: ...ta in the data tree and drag them to the Step 1 Data box The associated mapping analysis data is displayed B Remove samples by selecting them and clicking the associated Remove button Figure 6 27 Sele...

Page 220: ...bout the Mismatch thresholds see Sample Mismatch Algorithm on page 379 4 Specify sample template attributes to call sample mismatches Skip this step to run a sample match report 5 Specify output file...

Page 221: ...2 Enter a name for the pedigree report in the File Name box 3 Click Save The path and data file name appear in the textbox B Click Report to run the Sample Mismatch report When the report is finished...

Page 222: ...le see below Legend description of the codes used in the report see page 224 Results a list of the CHP pairs with matching SNP calls and information about the Mismatch IBS score and the type of proble...

Page 223: ...g Data 215 The report can be displayed as a spreadsheet or in text editing software Figure 6 32 Sample Match report opened in spreadsheet software Header Legend Results GTYPE_manual book Page 215 Wedn...

Page 224: ...te Date and time the report was generated Elapsed time Time software took to generate the report Input Parameters Parameters input by user Mismatch Threshold Mismatch threshold selected Person Not app...

Page 225: ...n the report Figure 6 34 Sample Match Report legend Mismatch Legend Defines the Mismatch scores and describes the thresholds Mismatch Code Legend Defines person IDs and genders Has Problem Legend Not...

Page 226: ...he experiment for Chip 1 ChpType2 Array type used in the experiment for Chip 2 GTYPEeGen1 Gender called by GTYPE for Chip 1 GTYPEGen2 Gender called by GTYPE for Chip2 NumberOfCalledSNP Number of SNPs...

Page 227: ...g matched samples see page 212 Same as Step 2 in Sample Match Report Specify sample template attributes to call sample mismatches see below Specify output file name see page 212 Same as Step 3 in Samp...

Page 228: ...and template attributes for selection Template Name Drop down list of the available templates Template Attributes List of the attributes in the selected sample template Person Attribute used as a uni...

Page 229: ...move button to remove an attribute 5 Specify the Gender Symbols in the Male and Female boxes Sample Mismatch Report The Sample Mismatch report Figure 6 38 is a tab delimited text file providing Header...

Page 230: ...Software User s Guide The report can be displayed as a spreadsheet or in text editing software Figure 6 38 Sample Mismatch report opened in spreadsheet software Header Legend Results GTYPE_manual boo...

Page 231: ...t was generated Elapsed time Time software took to generate the report Input Parameters Parameters input by user Mismatch Threshold Mismatch threshold selected Person Attribute used to identify the pe...

Page 232: ...6 40 explain the codes used in the report Figure 6 40 Sample Mismatch Report legend Mismatch Legend Defines the Mismatch scores and describes the thresholds Mismatch Code Legend Lists the codes used...

Page 233: ...o not have matching attributes the pair is flagged with the appropriate mismatch code Figure 6 41 Sample Mismatch Report results Mismatch Code Summary Numbers of different types of conflicts discovere...

Page 234: ...les IBSMetric Mismatch score also known as Identity by State or IBS metric for the chip pair for more information see Sample Mismatch Algorithm on page 379 Has problem A code for the detection of prob...

Page 235: ...entered pedigree data for the samples The SNP Export tool has filters that allow you to filter out SNPs that do not meet particular requirements from the export You can filter by Allele Frequency Har...

Page 236: ...File Formats Haploview Export uses the same file format as Merlin see below for more information The marker file uses a tab delimited file format with two columns with a line for each SNP The first co...

Page 237: ...r marker with three columns indicating chromosome marker name and position in centiMorgans The data file and map file can include different sets of markers but markers that are absent from the map fil...

Page 238: ...Rates The recombination rates are calculated from the Genetic Map positions in the GTYPE file The genetic distance is the difference between current and following SNPs The genetic distance is converte...

Page 239: ...ee see below Step 2 Select SNP Filter Conditions Optional see page 232 Step 3 Select output options see page 235 3 Drag and Drop chp files from the Data Tree In this step you select the samples for ex...

Page 240: ...them and clicking the Remove button B Select virtual sets for grouping chips optional For more information on virtual sets see Displaying Data in Virtual Arrays on page 193 4 Select SNP Filter Conditi...

Page 241: ...or more information see Allele Frequency on page 381 Frequency Threshold Specify frequency threshold for filtering SNPs Hardy Weinberg Select to filter SNPs by their Hardy Weinberg Probability values...

Page 242: ...ndelian Error pedigree check Number of Errors per family Specify number of errors for filtering SNPs Specify Pedigree Information Opens the Pedigree Information dialog box to select pedigree attribute...

Page 243: ...ate attribute name For more information about the Mendelian Error filter see Mendelian Error on page 382 5 Select output options In this step you select the output file names and other options Figure...

Page 244: ...checkbox to export the SNPs for each chromosome into a different file E Click Export to begin the export The data is exported to the specified directory In addition the SNP Statistics report is creat...

Page 245: ...rtcut bar or select Tools SNP Export from the menu bar The SNP Export dialog box opens Figure 6 48 2 Click the Merlin GeneHunter or Haploview tab to select the export format Before exporting data for...

Page 246: ...following sections Step 1 Specify sample attributes containing pedigree information see below Step 2 Select samples to export see page 241 Step 3 Select output file names see page 243 Figure 6 48 SNP...

Page 247: ...template Person Unique identifier for the person from whom the sample was taken Family ID Unique identifier for the family Father Unique identifier for the father This field is blank null for founders...

Page 248: ...n the Template Attributes box Figure 6 50 Sample attributes for GeneHunter open source software export Affection Status Additional information about the disease status including Disease Freq of B Alle...

Page 249: ...s or analysis data in the data tree and drag them to the Samples box Figure 6 51 The associated mapping analysis data is displayed in the Samples box You can remove samples by selecting them and click...

Page 250: ...ple template with pedigree attributes to the samples Import sample attribute data Figure 6 52 SNP Filter Conditions dialog box optional Allele Frequency Select to use the Allele Frequency Filter for m...

Page 251: ...ce software outputs Figure 6 54 pValue Threshold Specify pValue threshold for filtering SNPs SNP Call Rate Specify the call rate for filtering SNPs Mendelian Error Select to filter SNPs with Mendelian...

Page 252: ...ome The chromosome separate files have the chromosome number concatenated to the file name Merlin format only Max number of SNPs per file GeneHunter format only GeneHunter open source software can onl...

Page 253: ...As dialog box to locate the directory and enter the file name 2 Click Save The path and data file name appear in the textbox D GeneHunter open source software format only Enter the values for Max Num...

Page 254: ...on for all the export types Figure 6 56 SNP Statistics report displayed in Excel SNP Unique identifier for the SNP Chromosome Chromosome number for the SNP Position Chromosome position for the SNP Har...

Page 255: ...nalysis for two samples 1 Click the LOH button or Select View LOH from the menu bar The LOH dialog box opens Figure 6 57 2 Enter a title for the LOH column in the SNP Table where the results will be d...

Page 256: ...drop down lists only show the analysis results displayed in the Mapping window 4 Select the Comparison Analysis from the drop down list 5 Click Run The delta RAS scores for each SNP are displayed in...

Page 257: ...ng with Mapping Data 249 You can use the copy sort export and other functions of the SNP table with the data in the LOH column s Figure 6 58 LOH column LOH GTYPE_manual book Page 249 Wednesday August...

Page 258: ...250 Affymetrix GeneChip Genotyping Analysis Software User s Guide GTYPE_manual book Page 250 Wednesday August 2 2006 11 31 AM...

Page 259: ...Chapter 7 Universal Tag Window GTYPE_manual book Page 251 Wednesday August 2 2006 11 31 AM...

Page 260: ...Chapter 7 GTYPE_manual book Page 252 Wednesday August 2 2006 11 31 AM...

Page 261: ...ted cell intensities and background values for each probe on selected Universal Tag assays The Universal Tag window functions are described in Overview see below Tag Table see page 256 Figure 7 1 Univ...

Page 262: ...ty values in the Universal Tag window are background subtracted values The background value is calculated for different sectors of the probe array nine sectors for the GenFlex array The lowest 2 of th...

Page 263: ...versal Tag window toolbar Table 7 1m Universal Tag toolbar button functions Menu Bar Command Toolbar Button Function Edit Find Opens the Find dialog box see page 258 Edit Copy Item Copies a highlighte...

Page 264: ...bar or click the Export button The Export As dialog box opens Figure 7 3 Tag ID The reference fragment name Tag Sequence The sequence position of the reference base in the reference fragment Sample I...

Page 265: ...into other applications To copy data 1 Highlight the data of interest in the table To select non adjacent rows press and hold the Ctrl key while you click the desired rows To select adjacent rows pres...

Page 266: ...Select Edit Remove Experiments from the menu bar The Select Experiments to Remove dialog box opens Figure 7 4 Choose the experiment name then click OK SEARCHING THE TABLE The Find feature searches the...

Page 267: ...le contents 1 Select the contents you wish to print in the table 2 Click Print or Select File Print from the menu bar The Print dialog box opens Figure 7 6 Figure 7 5 Find dialog box If the option is...

Page 268: ...change properties number of copies etc depending upon your system and printer 3 Select the All or Selection radio button All prints out the entire contents of the table Selection prints out the selec...

Page 269: ...Chapter 8 Probe Intensity Window GTYPE_manual book Page 261 Wednesday August 2 2006 11 31 AM...

Page 270: ...Chapter 8 GTYPE_manual book Page 262 Wednesday August 2 2006 11 31 AM...

Page 271: ...ee page 268 Probe Intensity Table see page 271 Overview The Probe Intensity Window displays intensity data for the probe cells of selected Mapping arrays The Probe Intensity window has two main compon...

Page 272: ...G PROBE INTENSITY DATA To view the probe intensity data for a particular feature in the mapping analysis window 1 Select the feature whose intensity values you wish to evaluate 2 Click the Probe Inten...

Page 273: ...the Intensity Plot To open the Probe Intensity window and select cell intensity data for display 1 Click the Probe Intensity window button in the Tools shortcut bar or select Run Probe Intensity from...

Page 274: ...tton in the Probe Intensity window toolbar or select Edit Add from the menu bar The Add Cell Intensity Data dialog box opens Figure 8 2 The Add Cell Intensity Data dialog box provides several options...

Page 275: ...ntensity window toolbar Table 8 1 Probe Intensity window toolbar button functions Menu Bar Command Toolbar Button Function Edit Add Opens the Add Cell Intensity Data dialog box see page 264 Edit Copy...

Page 276: ...u and select Options or View Options or click The Probe Intensity View Options dialog box opens 3 Select from the following formats Line Graph or Bar Graph see below Trace Plot see page 270 The desire...

Page 277: ...ty window BAR AND LINE GRAPH For Mapping assays Figure 8 5 the plot displays the intensity values for the probe cells used for the selected SNP see page 272 Figure 8 5 Intensity Plot for GTYPE assay b...

Page 278: ...pping assays the trace plot Figure 8 7 displays the intensities for the probe quartets used to detect the selected SNP Plots from different samples are stacked vertically in the plot A Gaussian curve...

Page 279: ...plays the probe set ID The rest of the columns display intensity information for each selected sample s cell intensity data file for each sample the table cells in a row display the individual cell in...

Page 280: ...obe Set Unique identifier for the SNP with the following information for each sample Sample Name With results for each probe cell in the probe set arranged by probe quartet and direction Sense Probe Q...

Page 281: ...the table on any data column in ascending or descending order In the table right click the column header of interest and click Sort Ascending or Sort Descending in the shortcut menu Multiple Column T...

Page 282: ...L INTENSITY DATA You can export data from the feature table for further analysis in other applications by Exporting data as a tabular format file see page 160 Copying selected cells to the system Clip...

Page 283: ...Chapter 9 NetAffx Annotations GTYPE_manual book Page 275 Wednesday August 2 2006 11 31 AM...

Page 284: ...Chapter 9 GTYPE_manual book Page 276 Wednesday August 2 2006 11 31 AM...

Page 285: ...h downstream analyses Within GTYPE researchers can download SNP annotation from the NetAffx Analysis Center to view and export annotations alongside the GTYPE allele calls SNP annotation includes dbSN...

Page 286: ...a set of default annotations when you first try to display data for an array in the Dynamic Model Mapping Analysis window or the MPAM Mapping Analysis window Figure 9 1 Click Download to download the...

Page 287: ...for downloading annotations You can download annotations for the GeneChip data displayed in the Results table using the NetAffx Annotation Display dialog box If you use this method you cannot downloa...

Page 288: ...ns All the available annotations are downloaded Figure 9 2 NetAffx Annotation Display dialog box Category Display Selection Lists the annotations available Description A brief description of the annot...

Page 289: ...USING THE NETAFFX ANNOTATIONS DOWNLOAD DIALOG BOX To download selected annotations using the NetAffx Annotations Download dialog box 1 Click the View Options button in the mapping analysis window tool...

Page 290: ...annotations available Click the button to display or conceal the available annotations for a particular GeneChip array Select the checkbox at the left of the Annotation name to select the annotation...

Page 291: ...annotations The progress of the download is displayed in the bar at the bottom of the dialog box Description A brief description of the annotation Double click in the description to view more informa...

Page 292: ...box 9 Click OK on the Defaults dialog box to close the dialog box The downloaded annotations will be displayed in the NetAffx Annotations Display dialog box as up to date Selecting Annotations for Dis...

Page 293: ...ow Figure 9 6 Setting the Advanced Options To initialize your access to the NetAffx Analysis Center 1 Click the View Options button in the mapping analysis window toolbar or Select View Option Setting...

Page 294: ...tions dialog box NetAffx Tab User Name An identifier for your NetAffx account Password A password selected for your account The user name and password are not required for most annotations and will be...

Page 295: ...e the Defaults dialog box and enter the information Figure 9 8 Advanced Options dialog box Annotations Local Directory Directory on the client where the annotation information is stored for local file...

Page 296: ...288 Affymetrix GeneChip Genotyping Analysis Software User s Guide GTYPE_manual book Page 288 Wednesday August 2 2006 11 31 AM...

Page 297: ...Chapter 10 Reports GTYPE_manual book Page 289 Wednesday August 2 2006 11 31 AM...

Page 298: ...Chapter 10 GTYPE_manual book Page 290 Wednesday August 2 2006 11 31 AM...

Page 299: ...analyzed A summary of information about the allele calls Quality control information This chapter describes How to open and generate reports see page 292 Details of the report contents see page 296 Ho...

Page 300: ...d depends upon the assay type and the process used to generate the report DISPLAYING REPORTS Algorithm reports automatically open when you perform a mapping analysis using either the Batch Analysis wi...

Page 301: ...rtcut bar to view the next report GENERATING MAPPING ARRAY REPORTS You can create an analysis report for mapping results from the data tree or menu bar To generate a report using the data tree 1 Selec...

Page 302: ...1 Select File Report from the menu bar The Report dialog box opens and displays analysis results files in the default directory Figure 10 4 The default report name is the name of the first analysis r...

Page 303: ...lick OK The report is displayed Figure 10 4 Report dialog box The default report name is the name of the first analysis results file in the selection A previously generated algorithm or array report w...

Page 304: ...oftware User s Guide MAPPING REPORTS The Mapping Algorithm report and the Mapping Analysis Results report contain the same components Figure 10 5 Dynamic Model Mapping algorithm report GTYPE_manual bo...

Page 305: ...Analysis Results Report The Mapping Analysis Results report compiles the report information for user selected analysis results files It contains the same SNP information as the mapping algorithm repor...

Page 306: ...the Mapping algorithm see Determining Sample Gender on page 328 Called Gender Gender assigned to the sample by the algorithm see Determining Sample Gender on page 328 SNP Call Rate Number of SNP calls...

Page 307: ...cked with the MPAM algorithm for QC purposes see Contamination QC Check on page 345 MDR DM mapping only MPAM Detection Rate The number of SNPs passing the MPAM discrimination filter Total number of SN...

Page 308: ...the Report window To change the font 1 Select View Set Font from the menu bar The Font dialog Figure 10 8 box opens Table 10 2 Report toolbar button functions Menu Bar Command Toolbar Button Function...

Page 309: ...t the desired options for the font 3 Click OK The report is displayed with the selected font options SEARCHING A REPORT To start a text search 1 Click the Find button or Select Edit Find from the menu...

Page 310: ...l of the report right click the report and click Select All in the shortcut menu or select the part of the report that you want to copy 2 Right click the selection and click Copy in the shortcut menu...

Page 311: ...e than one report is open click the Report shortcut button to view the different reports 2 Click the Print button or Select File Print from the menu bar The Print dialog box opens Figure 10 10 3 Speci...

Page 312: ...304 Affymetrix GeneChip Genotyping Analysis Software User s Guide GTYPE_manual book Page 304 Wednesday August 2 2006 11 31 AM...

Page 313: ...Appendix A Installing GTYPE Software GTYPE_manual book Page 305 Wednesday August 2 2006 11 31 AM...

Page 314: ...Appendix A GTYPE_manual book Page 306 Wednesday August 2 2006 11 31 AM...

Page 315: ...S Server see page 314 Overview You can use GTYPE software version 4 1 with A stand alone process database installed on your computer A remote GCOS Server database on a network See your system administ...

Page 316: ...ion 4 1 PN 690051 to a directory on your computer 2 Unzip the installation files to another directory on your computer 3 Click Install exe in that directory The GTYPE splash screen opens Figure A 1 fo...

Page 317: ...se Agreement opens Figure A 3 5 Review the contents and click Yes in each window to accept the terms of the licensing agreement Figure A 2 GTYPE software install Welcome window Figure A 3 GTYPE softwa...

Page 318: ...y and Serial Number The serial number is located on the GTYPE Product Registration card If you do not have a serial number contact Affymetrix 7 Click Next The Choose Destination Location window opens...

Page 319: ...m Files Affymetrix GTYPE 4 1 is the default location 9 Click Next The Ready to Install the Program window opens Figure A 6 10 Click Install Figure A 5 GTYPE Choose Destination Location window Figure A...

Page 320: ...dow opens Figure A 7 After the files are copied the InstallShield Wizard Complete window opens Figure A 8 11 To exit the InstallShield Wizard click Finish Figure A 7 GTYPE software Setup Status window...

Page 321: ...elect Tools Defaults from the menu bar The Defaults dialog box opens 2 Click the Database tab to display the database options 3 Check the GCOS Server checkbox 4 Click OK to close the Defaults dialog b...

Page 322: ...1 Download the GeneChip Genotyping Analysis Software version 4 1 PN 690051 to a directory on your computer 2 Unzip the installation files to another directory on your computer 3 Click Install exe in...

Page 323: ...files are copied the InstallShield Wizard Complete window opens Figure A 12 5 To exit the InstallShield Wizard and restart your computer click Finish Figure A 11 GTYPE software Install Welcome window...

Page 324: ...316 Affymetrix GeneChip Genotyping Analysis Software User s Guide GTYPE_manual book Page 316 Wednesday August 2 2006 11 31 AM...

Page 325: ...Appendix B MPAM Mapping Algorithm GTYPE_manual book Page 317 Wednesday August 2 2006 11 31 AM...

Page 326: ...Appendix B GTYPE_manual book Page 318 Wednesday August 2 2006 11 31 AM...

Page 327: ...Affymetrix GeneChip Mapping 10K Array consists of a number of probe cells or features Each probe cell contains many copies of a unique 25 base oligonucleotide probe of defined sequence The probe cells...

Page 328: ...The SNP probe set always uses a probe quartet with the SNP site centered in the oligonucleotide It also uses probe quartets that offset the center interrogation position by moving the position up and...

Page 329: ...ee Model Description on page 325 The MPAM mapping algorithm uses the following steps 1 Evaluate specific and non specific hybridization for a SNP s probe cells using the discrimination filter see belo...

Page 330: ...ic hybridization by comparing the intensities for the mismatch cells to the intensities for the perfect match cells The discrimination filter uses the following 1 First discrimination scores for the S...

Page 331: ...median values to calculate a discrimination score for the SNP DSsnp max min DS s A DS t A min DS s B DS t B Where DSsnp Discrimination score for the SNP 3 The algorithm evaluates the SNP discriminatio...

Page 332: ...for the quartet is calculated B The MPAM mapping algorithm calculates the relative intensity values for the A and B alleles C The MPAM mapping algorithm uses these values to calculate the RAS value f...

Page 333: ...is indicates that the probes for that SNP are unreliable and no allele call is given for that SNP CALLING THE ALLELE The MPAM mapping algorithm uses a model based method to make the allele calls for e...

Page 334: ...contains information about the medoids for the three allele calls for each SNP on the array 6 A generic model and gender specific models were constructed for SNPs on the X chromosome Calculating the...

Page 335: ...d and the sample s sense and antisense RAS values R is the distance between the tested allele call medoid and the nearest alternate allele call medoid divided by 2 as follows For the AA medoid 2R is t...

Page 336: ...ore is greater than the call zone bound for all of the allele calls the SNP is declared a No Call DETERMINING SAMPLE GENDER Gender specific models are used for genotyping of SNPs on the X chromosome b...

Page 337: ...Figure B 6 Typical distribution of RAS values for an X chromosome SNP for samples from females BB AB AA Model Medoids RAS1 Sense RAS2 Antisense Sense and Antisense plots for samples BB AB AA Model Me...

Page 338: ...is below this value the sample is assigned the male gender After the gender is determined the algorithm is run again using a gender based model for the X chromosome The accuracy of the gender determin...

Page 339: ...accuracy Table B 1 explains the settings and how changing a value affects the analysis 1 To view the user modifiable algorithm settings click the Mapping Algorithm Settings button in the Settings sho...

Page 340: ...4 To change a setting A Click the item you want to change The current value for the item is displayed Figure B 7 B Enter a new value for the item 5 To return all settings to the defaults click Default...

Page 341: ...ination algorithm See Determining Sample Gender on page 328 N A N A CallZoneBound Call Zone limit for DTR ratio value See Calling the Allele on page 328 Increase Increase DSBound Discrimination Filter...

Page 342: ...334 Affymetrix GeneChip Genotyping Analysis Software User s Guide GTYPE_manual book Page 334 Wednesday August 2 2006 11 31 AM...

Page 343: ...Appendix C Dynamic Model Mapping Algorithm GTYPE_manual book Page 335 Wednesday August 2 2006 11 31 AM...

Page 344: ...Appendix C GTYPE_manual book Page 336 Wednesday August 2 2006 11 31 AM...

Page 345: ...g 100K Set or the GeneChip Mapping 250K Nsp Array and GeneChip Mapping 250K Sty Array in the GeneChip Human Mapping 500K Set consist of a number of probe cells or features Each probe cell contains man...

Page 346: ...isense strands of the sample The SNP uses probe quartets with the center interrogation position placed in different sequence locations by moving the sequence position up and down stream of the SNP sit...

Page 347: ...odel based algorithm using Wilcoxon s signed rank test see page 347 It provides a genotype call for each SNP along with quality information for the call The Dynamic Model mapping algorithm compares th...

Page 348: ...The Dynamic Model mapping algorithm uses the following steps 1 Calculate four different quantitative log likelihoods l values one for each model null AA AB BB for each of the ten probe quartets in the...

Page 349: ...d values for the mean The log likelihood is calculated as Where for a given probe quartet k index for the probe cell in the quartet 1 2 3 4 nk number of pixels mk cell intensity vk standard deviation...

Page 350: ...ratios LLRs or S values are calculated by comparing the log likelihood value for a selected model of a probe quartet to the highest remaining log likelihood value for the quartet SN lN max lA lB lAB S...

Page 351: ...ed on the 10 quartet values for that model For example to calculate the AB rank score the algorithm would use the S values for the AB model for quartets 1 through 10 Figure C 5 Figure C 4 S value matr...

Page 352: ...to the model else if RS threshold assign genotype call to no call For more information see Dynamic Model Mapping Algorithm Settings on page 351 Figure C 5 Calculating rank scores AA AB BB NC q1 SA SA...

Page 353: ...parisons of genotype calls for different samples The first transformation accentuates the areas of interests in the rank score The scale is 0 1 but genotypes are only called for rank scores less than...

Page 354: ...sumption of only three possible allelic ratios will be violated for many SNPs resulting in lower call rates However whether or not the sample is contaminated the detection rate will remain high as it...

Page 355: ...ative hypothesis H1 median gi hi 0 Note that we use the one sided test here For the one sided test if the null hypothesis is true the rank score should be close to 0 5 When the alternative hypothesis...

Page 356: ...he integer ranks Table C 1 Absolute values Original position non zero differences convert to absolute values 1 d1 2 a1 2 2 d2 1 a2 1 3 d3 2 a3 2 4 d4 0 5 a4 0 5 5 d5 0 5 a5 0 5 Table C 2 Assigning ran...

Page 357: ...ive ranks and denote this sum by Sj j 1 2n We define where if Sj S then u Sj S is 1 if Sj S then u Sj S is 0 if Sj equals S then u Sj S is 1 if Sj does not equal S then u Sj S is 0 In our example all...

Page 358: ...5 4 5 6 13 1 5 1 5 3 4 5 4 5 6 14 1 5 1 5 3 4 5 4 5 7 5 15 1 5 1 5 3 4 5 4 5 7 5 16 1 5 1 5 3 4 5 4 5 9 17 1 5 1 5 3 4 5 4 5 6 18 1 5 1 5 3 4 5 4 5 7 5 19 1 5 1 5 3 4 5 4 5 7 5 20 1 5 1 5 3 4 5 4 5 9...

Page 359: ...these settings as adjusting the parameters to increase call rates may decrease the accuracy seepage 352 The table below explains the settings and how changing a value affects the analysis 1 To view t...

Page 360: ...c Model Mapping calling algorithm user adjustable parameters Item Description Effect of Changing the Settings Setting Change Number of Calls Homozygote Call Threshold The homozygote calls with confide...

Page 361: ...Appendix D Bayesian Robust Linear Model with Mahalanobis BRLMM Distance Classifier Algorithm GTYPE_manual book Page 353 Wednesday August 2 2006 11 31 AM...

Page 362: ...Appendix D GTYPE_manual book Page 354 Wednesday August 2 2006 11 31 AM...

Page 363: ...BRLMM provides a significant improvement over the DM Dynamic Model algorithm in two important areas It improves overall performance call rates and accuracy and balances performance on homozygous and h...

Page 364: ...adaptive estimation of cluster centers and variances avoiding RLMM s reliance on predetermined cluster centers and variances from known reference genotypes Performance improvement is achieved by two...

Page 365: ...nce Classifier Al probe intensities than does DM making them far more robust in the presence of real world data Figure D 1 below presents an overview of the BRLMM workflow Figure D 1 BRLMM Algorithm W...

Page 366: ...subset of SNPs is used to estimate a prior distribution on the typical cluster centers and variance covariance matrices A default of 10 000 SNPs is used To adjust the number of SNPs needed to generate...

Page 367: ...probe intensities 3 in order to minimize chip to chip nonbiological variability Normalization is essential for implementing a multi chip model to the probe intensities This normalization method assume...

Page 368: ...model did not yield better i e more readily separated estimates for S We are continuing to explore the topic of using mismatch probes in our analysis Clustering Space Transformation When signals for t...

Page 369: ...re above Figure D 2 plots the signal strength log2 SA SB against the allele contrast SA SB SA SB and the contrast is transformed by a transformation we call the Cluster Center Stretch CCS transformati...

Page 370: ...totype is expected The scatter is approximated by a multivariate normal distribution and the careful choice of the CCS transformation ensures that this is a good approximation For clusters of this typ...

Page 371: ...ng Algorithm Settings BRLMM Mapping Algorithm Settings page 371 The next section describes how we find the prototypes and how they vary from the data for each SNP Estimating Cluster Centers and Varian...

Page 372: ...tes of cluster centers and variances are indicated by the magenta x s and ellipses In all cases the ellipses extend to a Mahalanobis distance of 2 from the cluster center One thing to note is that in...

Page 373: ...is generally better to have more discussed in more detail in the Discussion section below The use of a random sample of SNPs allows for faster and more memory efficient processing only a small subset...

Page 374: ...in S is obtained by doing point wise shrinkage towards the prior estimate using an effective number of observations p which is selected up front i j ni j 1 wi j p si j ni j 1 p This Bayesian update h...

Page 375: ...as outlined in the previous section Special Cases The preceding algorithm assumes that the observations for each SNP are well described by prototypes for each genotype However for SNPs on the X chrom...

Page 376: ...is modified to remove it from the range of typical data this is to avoid having special purpose code for two or three prototypes This statistical surgery removes any reasonable possibility of making a...

Page 377: ...onsistently observed on a variety of data sets BRLMM achieves an improvement of about 0 1 in HapMap concordance compared to DM with a more stringent threshold of 0 26 about 0 2 compared to DM with a t...

Page 378: ...ower quality used here is a data set with an average call rate of less than or equal to 93 using DM at a threshold of 0 33 these call rates increase when called with BRLMM Numbers of samples are actua...

Page 379: ...rection and understanding the criteria under which it will and won t succeed remains an area of future work BRLMM Mapping Algorithm Settings The BRLMM mapping algorithm incorporates user modifiable se...

Page 380: ...e a setting A Click the Parameter Value you want to change The current value for the item is displayed Figure D 5 B Enter a new value for the item To return all settings to the defaults click Default...

Page 381: ...t behavior for BRLMM is to estimate the optimal block size based upon the amount of memory that appears to be free at the time the job begins This default behavior can be overridden by the user with t...

Page 382: ...out how many probesets to run at once i e the block size in 1 9 gigabytes of RAM as a function of number of CEL files 50 CEL files 140 000 probesets i e half the dataset for a mapping 250K chip plus s...

Page 383: ...creening and Genotyping Over 100K SNPs on Oligonucleotide Microarrays Bioinformatics Vol 21 9 pp 1958 1963 2005 3 Bolstad B M Irizarry R A et al A Comparison of Normalization Methods for High Density...

Page 384: ...376 Affymetrix GeneChip Genotyping Analysis Software User s Guide GTYPE_manual book Page 376 Wednesday August 2 2006 11 31 AM...

Page 385: ...Appendix E Mapping Tool Algorithms GTYPE_manual book Page 377 Wednesday August 2 2006 11 31 AM...

Page 386: ...Appendix E GTYPE_manual book Page 378 Wednesday August 2 2006 11 31 AM...

Page 387: ...s are shared The table below lists the Mismatch scores for different genotype pairs The report uses the averaged Identity by State IBS metric calculated over a set of 30 to 50 common SNPs as a measure...

Page 388: ...tch report see Using the Sample Mismatch Report Tool on page 208 Filter Algorithms The export filter functions allow you to export only SNPs that meet particular criteria Allele Frequency see page 381...

Page 389: ...nor allele frequency is the Min pA pB HARDY WEINBERG PROBABILITY The Hardy Weinberg probability is a measure of the significance of the discrepancy between the observed ratio of heterozygote calls in...

Page 390: ...he samples This allows you to identify incorrectly identified samples and other problems The pedigree checking uses a Lange Goradia algorithm The algorithm is able to determine Mendel errors across mu...

Page 391: ...es If the Mendelian errors for any one of the families is above the threshold the user shall have the option to filter the SNPs by either Removing the SNP from the export Setting all of the SNP genoty...

Page 392: ...384 Affymetrix GeneChip Genotyping Analysis Software User s Guide GTYPE_manual book Page 384 Wednesday August 2 2006 11 31 AM...

Page 393: ...Appendix F IUPAC Base Codes GTYPE_manual book Page 385 Wednesday August 2 2006 11 31 AM...

Page 394: ...Appendix F GTYPE_manual book Page 386 Wednesday August 2 2006 11 31 AM...

Page 395: ...or T U Weak interaction 2 H bonds Y C or T U pYrimidine S C or G Strong interaction 3 H bonds K G or T U Keto V A or C or G not T or not U since V follows U H A or C or T U not G since H follows G D A...

Page 396: ...388 Affymetrix GeneChip Genotyping Analysis Software User s Guide GTYPE_manual book Page 388 Wednesday August 2 2006 11 31 AM...

Page 397: ...Appendix G File Types GTYPE_manual book Page 389 Wednesday August 2 2006 11 31 AM...

Page 398: ...Appendix G GTYPE_manual book Page 390 Wednesday August 2 2006 11 31 AM...

Page 399: ...Experiment Data File Name Created in Description Experiment information file exp Affymetrix GCOS Contains information about the experiment name sample and probe array type The experiment name also pro...

Page 400: ...results Graphics file tif GTYPE A standard file format for graphic images GTYPE exports graphic images in this file format Data file txt GTYPE txt is a standard format for text files GTYPE exports an...

Page 401: ...Appendix H Working with Windowpanes Columns GTYPE_manual book Page 393 Wednesday August 2 2006 11 31 AM...

Page 402: ...Appendix H GTYPE_manual book Page 394 Wednesday August 2 2006 11 31 AM...

Page 403: ...size the windowpane Resizing or Hiding Table Columns You can resize or hide columns in the table view 1 Position the mouse over the left or right cell border in the column header so that it changes to...

Page 404: ...e left or right cell border of the column header until the column width is reduced to zero or right click the column header in the table and click Hide Column in the shortcut menu Figure H 2 Right cli...

Page 405: ...Appendix I Hot Key Descriptions GTYPE_manual book Page 397 Wednesday August 2 2006 11 31 AM...

Page 406: ...Appendix I GTYPE_manual book Page 398 Wednesday August 2 2006 11 31 AM...

Page 407: ...Edit Paste Ctrl V Edit Image Settings S Edit Delete Del Edit Find Next F3 View Grid G View Probe Cell Data C View Corner Upper Left F5 View Corner Upper Right F6 View Corner Lower Left F7 View Corner...

Page 408: ...3 etc toggle between open image windows I Image window zoom in O Image window zoom out Shift O Image window full zoom out L intensity autoscale Help F1 Table I 1 Hot key descriptions Menu Bar Command...

Page 409: ...Index GTYPE_manual book Page 401 Wednesday August 2 2006 11 31 AM...

Page 410: ...GTYPE_manual book Page 402 Wednesday August 2 2006 11 31 AM...

Page 411: ...renaming results 123 toolbar 119 bookmarks creating 99 editing 100 viewing 99 C call zone bound 328 call zone radius 328 controlling display in RAS Scatter Plot 173 174 call zone score 147 calculating...

Page 412: ...ment assigned in GCOS 60 See GeneChip Operating System GCOS GCOS Server 50 307 installing GTYPE server components 314 selecting 51 gender attribute parameters 130 assigning in GCOS 131 defining in GDA...

Page 413: ...iversal Tag analysis 44 P Pedigree Check Tool running 202 210 219 Pedigree Check tool 201 pedigree data creating file 186 importing 185 186 Pedigree report 206 placeholder samples 185 190 printing RAS...

Page 414: ...159 printing 163 Sort dialog box 157 starting GTYPE 50 changing process database 51 status log 55 76 T Table view hiding columns 395 resizing 395 Tables tab Mapping View Op tions dialog box 156 task b...

Reviews: