background image

15

G-Link-200-OEM 

USER MANUAL

4.4 Power

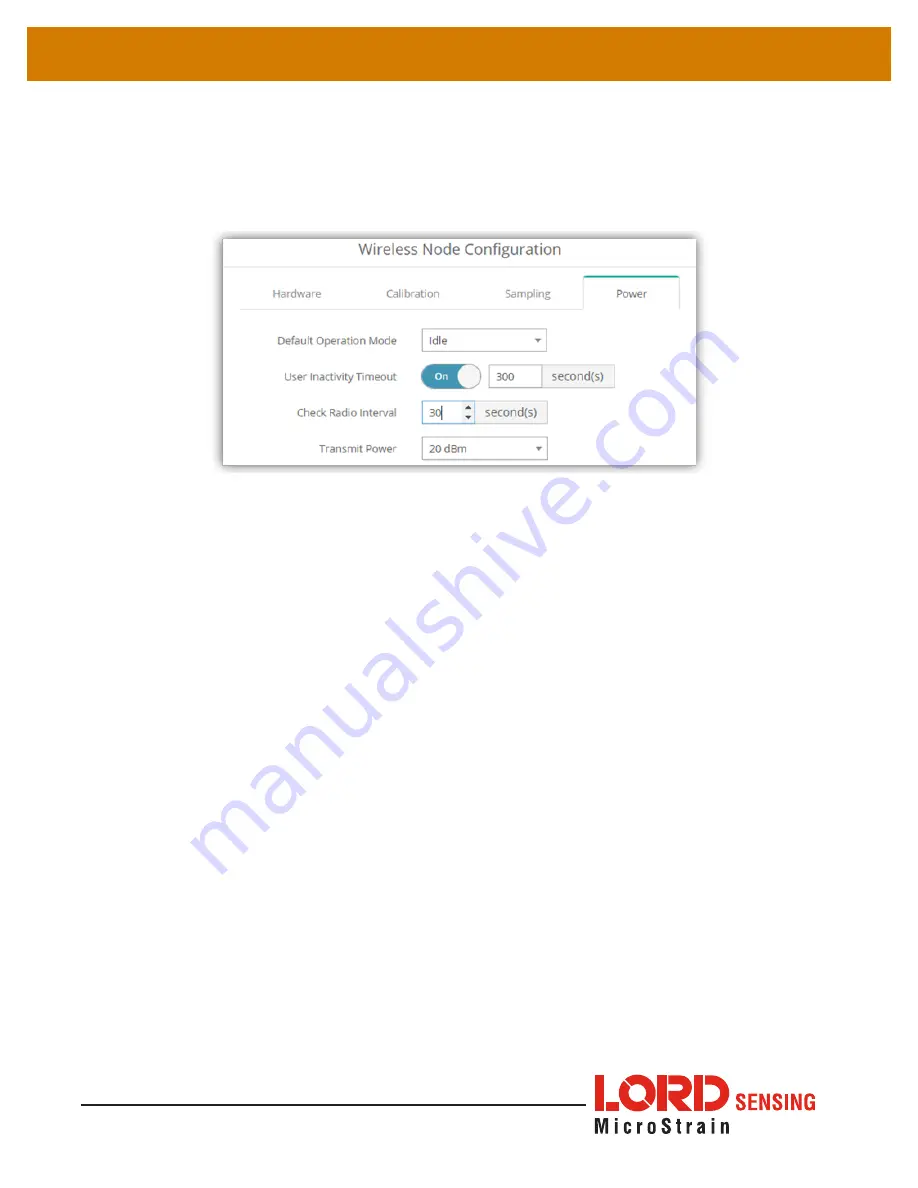
There are multiple user-set power options for the G-Link-200-OEM, including Default 

Operation Mode, User Inactivity Timeout, Check Radio Interval, and Transmit Power, in the 

Wireless Node Configuration > Power menu.

Figure 14.  Node Configuration Power Menu

Default Operation Mode 

- When power is applied, the node will enter the Default Operation 

Mode.

User Inactivity Timeout

 - While in Idle mode, the node will automatically enter Sleep mode 

if it does not receive any commands for the selected amount of time. If Sample is selected 

under Default Operation Mode, the node will automatically re-enter the sample mode it 

performed last with all current settings. Disable User Inactivity Timeout to avoid the node 

automatically changing states.

Check Radio Interval

 - While in Sleep and Sample modes, the Check Radio Interval sets 

the frequency the node checks the radio channel for a “Set to Idle” command. Decreasing the 

Check Radio Interval will shorten the amount of time it takes to wake the node into Idle mode 

with the cost of decreasing battery life. Increasing the Check Radio Interval could increase 

battery life at the cost of increasing the amount of time it takes to wake the node into its Idle 

mode.

Transmit Power

 - Set the output power of the radio to a value between 0dBm to +20dBm.

The output power will effect communication range and also battery life.

Summary of Contents for 6305-6002

Page 1: ...LORD USER MANUAL G Link 200 OEM Wireless Accelerometer Node...

Page 2: ...oration 3DM 3DM DH 3DM DH3 3DM GX2 Ask Us How DEMOD DC DVRT EmbedSense FAS A G Link Little Sensors Big Ideas LORD Microstrain Live Connect LXRS MathEngine MicroStrain MIP MXRS Node Commander SensorClo...

Page 3: ...5 Figure 3 Node Operational Modes 6 3 System Operation 7 3 1 Software Installation 7 3 2 Gateway Communication 8 Figure 4 USB Gateway Communication 8 3 3 Connect to Nodes 8 3 3 1 Automatic Node Discov...

Page 4: ...15 Figure 14 Node Configuration Power Menu 15 5 Wireless Sensor Sampling Configuration 16 5 1 Start Collecting Data 16 Figure 15 Single Node Sampling 16 Figure 16 Network of Nodes Sampling 16 5 2 Net...

Page 5: ...e 26 MathEngine View 27 Figure 27 FFT Graph in SensorCloud 27 6 2 SensorConnect 28 6 2 1 Using Dashboards and Widgets 28 Figure 28 Viewing Data 28 6 2 2 Navigating Graphs 28 Table 8 Graph View Control...

Page 6: ...structions 38 Warranty Repairs 38 Non Warranty Repairs 38 9 Specifications 39 9 1 Physical Specifications 39 9 2 Operating Specifications 40 9 3 Mechanical Shock Limits 41 10 Safety Information 42 10...

Page 7: ...many types of sensors including accelerometers strain gauges pressure transducers load cells torque and vibration sensors magnetometers 4 to 20mA sensors thermocouples RTD sensors soil moisture and hu...

Page 8: ...ms Amplitude Grms and Gpk pk and Crest Factor allowing long term monitoring of key performance indicators while maximizing battery life To acquire sensor data the G Link 200 OEM is used with a LORD Se...

Page 9: ...e following configuration options Product Model Part Number G Link 200 OEM integrated chip antenna 8G 40G 6305 6002 6305 6003 G Link 200 OEM MMCX IP67 whip antenna 8G 40G 6305 6181 6305 6141 G Link 20...

Page 10: ...face Kit Power connector and mating cable factory installation available at time of purchase 6306 1030 Mounting Kit Mounting base and 4 screws 6306 1031 MMCX indoor whip antenna 2 5 dBi antenna with 3...

Page 11: ...sampling Node is resynchronizing Red LED Built in test error Table 3 Indicator Behaviors 2 4 Node Operational Modes Sensor nodes have three operational modes active sleep and idle When the node is sam...

Page 12: ...6 G Link 200 OEM USER MANUAL Figure 3 Node Operational Modes...

Page 13: ...ing SensorConnect is PC based software used for configuring gateways and nodes selecting sampling modes and parameters initializing data acquisition and viewing and saving data 3 1 Software Installati...

Page 14: ...tomatically with a communication port assignment If the gateway is not automatically discovered verify the port is active on the host computer and then remove and re insert the USB connector Figure 4...

Page 15: ...Nodes on Other Frequencies tile Figure 6 Node On Other Frequency Highlight the new node being added and select Move Node to Frequency Figure 7 Move Node 3 3 3 Manually Add Node Adding a node manually...

Page 16: ...ill appear This means the node did not respond to the base station which could indicate the node is not in idle mode or it may be on another frequency If Add Node Anyway is selected it will associate...

Page 17: ...dth and maintaining excellent noise performance The first stage is an analog fixed frequency anti aliasing filter with 3 dB attenuation at 800 Hz and 6 18 dB attenuation at 1500 Hz The second is a use...

Page 18: ...High Pass Filter Values 4 2 Calibration Configuration Each node is calibrated at the factory and stores its linear calibration coefficients in nonvolatile memory These coefficients are applied by the...

Page 19: ...e will save power in this state without user intervention until the beacon returns Within two minutes of the beacon returning the node will automatically begin sampling and transmitting data again Dia...

Page 20: ...est Result 0 no errors unit 32 Internal Temperature Valid range 40 to 125 C unit 8 Celsius Low Battery Indicator 0 good 1 low 2 critical sensor will stop sampling unit 8 External Power 0 not connected...

Page 21: ...e node will automatically re enter the sample mode it performed last with all current settings Disable User Inactivity Timeout to avoid the node automatically changing states Check Radio Interval Whil...

Page 22: ...ng mode by pressing and holding the start button until the LED light turns blue Single node From Devices select Node Sampling Apply and Start Network to begin collecting data from a single wireless se...

Page 23: ...he WSDA gateway Each beacon contains a UTC timestamp allowing nodes to align their collected data within an accuracy of 50 us Each node will also buffer data and transmit this data in time slots alloc...

Page 24: ...rformance in environments where packet error rate is as much as 50 Allows for operation in situations where the node and gateway move in and out of range with each other Potential for higher latency L...

Page 25: ...lue from the window and dividing by the RMS of the window Peak to Peak is calculated by subtracting the smallest value from the window from the largest value Velocity IPS or m s The RMS of the IPS is...

Page 26: ...s that the derived period must be at least 32 times as long as the sample period Burst is not limited by this restriction because the minimum burst size is 100 samples 5 4 2 Chunks Windows can encompa...

Page 27: ...lower frequencies is to reduce the sample rate 5 4 4 Incoherence Derived channels are most accurate when the window time is a multiple of the period of the input signal meaning that the window is coh...

Page 28: ...iodic intervals This operation allows longer battery life and increased network sizes in applications where continuous monitoring is not required Event Triggered Collect data continuously at a fixed s...

Page 29: ...OEM USER MANUAL 5 6 Output Operation There are three options for managing data acquired from the G Link 200 OEM The user can transmit collected data log the data to flash memory or do both Figure 22...

Page 30: ...ical analysis and advanced algorithm development with the integrated MathEngine interface Leveraging the open source API SensorCloud can also be used to collect data from other LORD Sensing sensor pro...

Page 31: ...w is for logistic management of the SensorCloud account such as changing the log in password accessing user email and reviewing billing information CSV Uploader The data upload feature enables data fr...

Page 32: ...ime zone and more MathEngine is used to analyze sensor data Functions include the ability to filter out frequencies smooth out noisy data perform math operations such as Fast Fourier Transforms FFTs a...

Page 33: ...200 OEM USER MANUAL Figure 26 MathEngine View Figure 27 FFT Graph in SensorCloud For more information about SensorCloud features and navigation refer to the SensorCloud website or contact LORD Sensin...

Page 34: ...nt reading This format provides an easy way to organize many sensors and networks and it allows the information to be displayed in the most appropriate layout Figure 28 Viewing Data 6 2 2 Navigating G...

Page 35: ...select and configure it in the Channels and Settings left sidebar menu Under Channels the channel s for the widget can be enabled and disabled Figure 29 Widget Settings Menu 6 2 4 Time Series Widget...

Page 36: ...MANUAL 6 2 5 Exporting Data Files To export data to a csv file select the Export Data button on the Time Series widget Export name the document save to the preferred location on the host computer Fig...

Page 37: ...ized outdoor enclosure There are 4 mounting holes on the G Link 200 OEM for 2 56 UNC screws The node can be mounted in any orientation but it is recommended that it is mounted in a way that optimizes...

Page 38: ...unting Height of the node to allow a clearer LOS path to the gateway Height above the ground is also important because reflections off of the ground can interfere at the receiver Generally the higher...

Page 39: ...figure menu and is highly dependent on the physical environment surrounding the devices 1 Select the node name Range Test Figure 34 Range Test Menu 2 RSSI is a measure of signal strength between the n...

Page 40: ...6 Data Type Menu Float 4 Bytes The node applies calibration coefficients locally and reports measurements as floating point values Int24 3 Bytes The node sends its 20 bit measurements as signed 24 bit...

Page 41: ...35 G Link 200 OEM USER MANUAL 8 Troubleshooting 8 1 Troubleshooting Guide...

Page 42: ...ample or sleep state 2 4 node is out of range Perform a bench test with the node in close proximity to the gateway to verify they are operational For range test and installation recommendations The sy...

Page 43: ...ll also be flashing the sampling mode code If the node is not sampling activate it in the software or with a sample on start up boot sequence 3 4 sensor is not connected correctly Verify sensors conne...

Page 44: ...ng manuals accessories cables etc with the RMA number clearly printed on the outside of the package Removable batteries should be removed and packaged in separate protective wrapping Please provide th...

Page 45: ...39 G Link 200 OEM USER MANUAL 9 Specifications 9 1 Physical Specifications Dimensions 38 1 mm x 6 5 mm x 29 mm Mounting 4 x 2 56 UNC Weight 8 17 grams Conformal Coating Humiseal 1B31...

Page 46: ...figurable Integrated Temperature Channel Measurement range 40 C to 85 C Accuracy 0 25 C over full range Sampling Sampling modes Continuous periodic burst event triggered Output options Acceleration Ti...

Page 47: ...wer setting and the supply voltage Repeated exposure to 2x full scale can result in permanent damage 9 3 Mechanical Shock Limits The accelerometers used by the G Link 200 are sensitive instruments tha...

Page 48: ...ndent on the operational parameters such as sample mode and rate More active channels and higher sample rates equate to decreased battery life The G Link 200 OEM contains internal non rechargeable lit...

Page 49: ...gured to operate on 16 separate frequencies ranging from 2 405 GHz to 2 480 GHz Following the 802 15 4 standard these frequencies are aliased as channels 11 through 26 For all newly manufactured nodes...

Page 50: ...ions Technical Support sensing_support LORD com Phone 802 862 6629 Live Chat is available from the website during business hours 9 00 AM to 5 00 PM Eastern Time US Canada 11 2 Sales Support Products c...

Page 51: ...oud Pricing http sensorcloud com pricing MathEngine Overview http www sensorcloud com mathengine LORD Sensing Wireless Sensors Network Software Development Kit https github com LORD MicroStrain Sensor...

Reviews: