


B-06-1006, Rev. E Tuff Tilt Digital
35
9
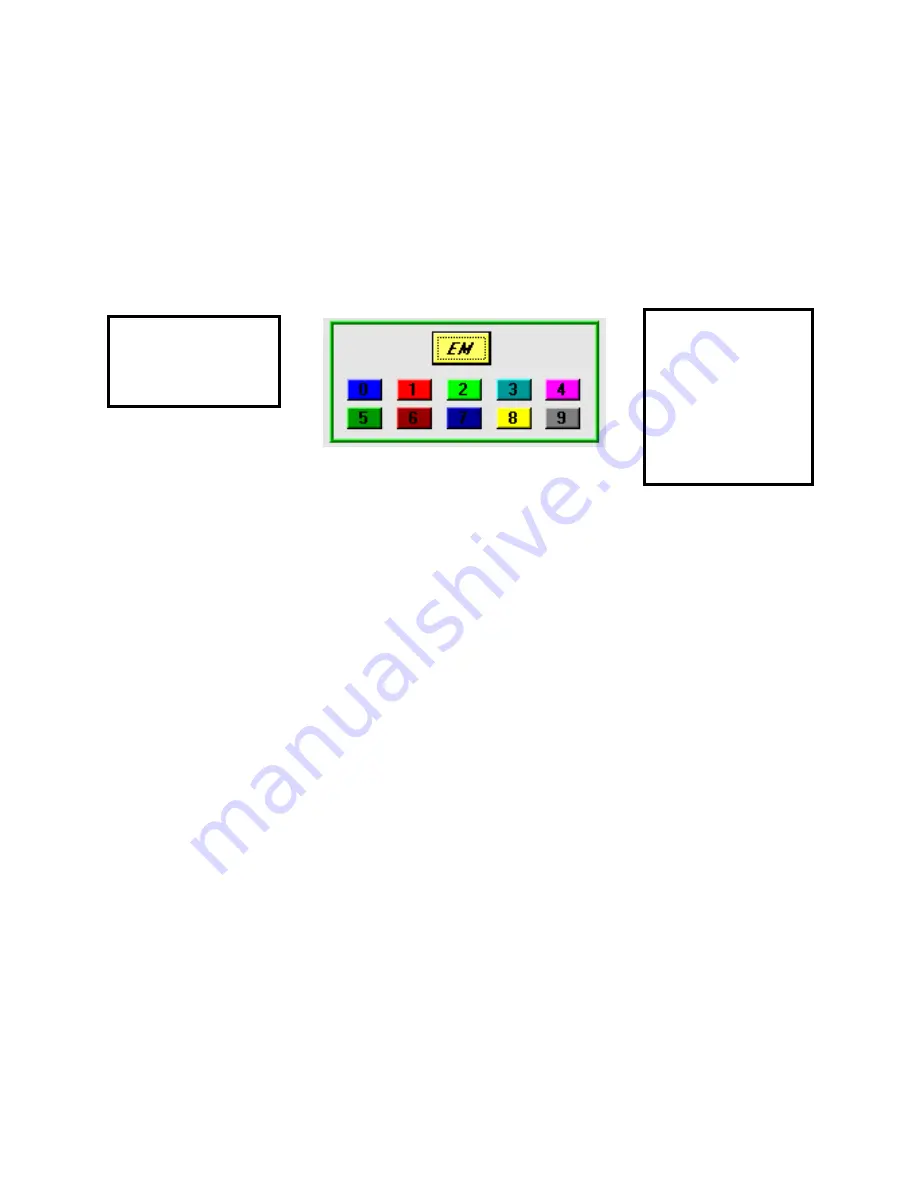
Event Markers; Plotting Saved Files
Event markers are used to distinguish one part of the time series displayed on the strip chart
recorder from another. With the clinometer running, pushing the yellow “EM” button causes the color of
the line on the strip chart to change color - as shown by the colored boxes below the “EM” button. The
default color is always blue. Blue is event “0” and is designated in a saved data set with a zero at the end
of the delimited string. When the “EM” button is pushed for the first time, the line color on the graph
changes from blue to red, and the data is appended with the number 1. The red box with the number one in
it also changes to bright red, indicating that event 1 is presently being plotted.
The Event Marker buttons are also used to plot data that have been saved to a file on your PC.
After choosing to plot a saved data file from the command line menu options (Plots > Plot Saved File),
pushing the “EM” button plots the entire time series. Pressing any one of the active individual event
markers plots only that event.
10
Data Logging to Tiltmeter Memory
Jewell digital tiltmeters running firmware version 2.3 or later have the capability to store approximately 150 lines of data
in the instrument’s FLASH memory. This memory is nonvolatile and will be retained when power to the instrument is
turned off or disconnected. It is important to keep in mind the following conditions when using the logging capability:
1.
Only the simple string format is supported for data logging operations.
2.
Select the simple (SIM) string format and the desired output rate before starting the instrument in
logging mode.
3.
To log data, clink on “
Memory Options
” and then “
Log Data
.” Next, click on the “
Start
”
button.
4.
There will be a 3-4 second delay after the “
Start
” button is pushed. Then the program will tell
you how long the tiltmeter will be able to store readings in its memory. Click “
OK
” to begin
logging.
5.
After the buffer is filled, the instrument will stop logging, but it does not shut down. The readings
will continue to be taken at the predetermined sample rate and then sent out the serial port of the
instrument.
6.
After logging begins the computer can be disconnected from the tiltmeter, but power must be
continuously supplied to the instrument.
7.
In the event of a power interruption, the tiltmeter will stop saving measurements. However, all
measurements up to the power interruption will be retained in memory.
Press EM to change
events - or to plot an
entire saved data file.
These colors and
numerals indicate the
event color plotted on
the strip chart.
Pressing these while
plotting a saved file
plots the event on the
strip chart.
Summary of Contents for TuffTilt Digital
Page 6: ...B 06 1006 Rev E Tuff Tilt Digital 5 Figure 4 Wiring connections Tuff Tilt Digital ...
Page 9: ...B 06 1006 Rev E Tuff Tilt Digital 8 Figure 6 Box Mounting Details ...
Page 15: ...B 06 1006 Rev E Tuff Tilt Digital 14 Appendix A Firmware Commands ...
Page 40: ...B 06 1006 Rev E Tuff Tilt Digital 39 Appendix C Warranty and Limitation of Liability ...
Page 42: ...B 06 1006 Rev E Tuff Tilt Digital 41 Appendix D Revision Record ...