275
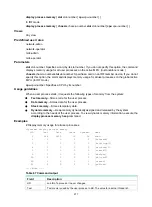
1 0.0% 0.0% 0.0% scmd
2 0.0% 0.0% 0.0% [kthreadd]
3 0.1% 0.0% 0.0% [ksoftirqd/0]
4 0.0% 0.0% 0.0% [watchdog/0]
5 0.0% 0.0% 0.0% [events/0]
6 0.0% 0.0% 0.0% [khelper]
29 0.0% 0.0% 0.0% [kblockd/0]
49 0.0% 0.0% 0.0% [vzmond]
52 0.0% 0.0% 0.0% [pdflush]
53 0.0% 0.0% 0.0% [pdflush]
54 0.0% 0.0% 0.0% [kswapd0]
110 0.0% 0.0% 0.0% [aio/0]
712 0.0% 0.0% 0.0% [mtdblockd]
719 0.0% 0.0% 0.0% [TNetJob]
720 0.0% 0.0% 0.0% [TMTH]
727 0.0% 0.0% 0.0% [CF]
730 0.0% 0.0% 0.0% [DIBC]
752 0.0% 0.0% 0.0% [lipc_topology]
762 0.0% 0.0% 0.0% [MNET]
763 0.0% 0.0% 0.0% [SYSM]
---- More ----
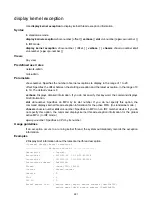
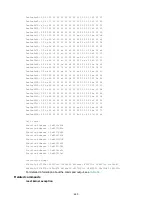
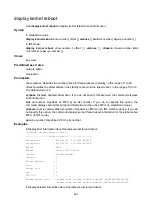
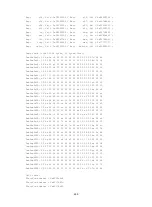
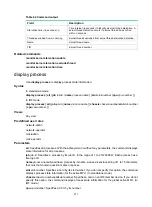
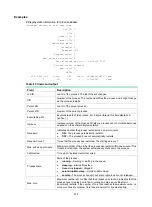
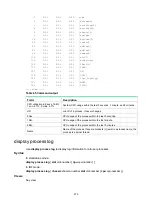
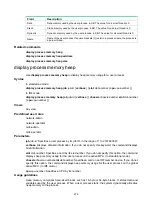
Table 65 Command output
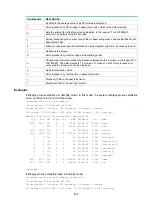
Field Description
CPU utilization in 5 secs: 16.8%;
1 min: 4.7%; 5 mins: 4.7%
System CPU usage within the last 5 seconds, 1 minute, and 5 minutes.
JID
Job ID of a process. It never changes.
5Sec
CPU usage of the process within the last 5 seconds.
1Min
CPU usage of the process within the last minute.
5Min
CPU usage of the process within the last 5 minutes.
Name
Name of the process. If square brackets ([ ]) exist in a process name, the
process is a kernel thread.
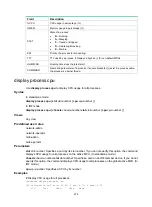
display process log
Use
display
process log
to display log information for all user processes.
Syntax
In standalone mode:
display
process
log
[
slot
slot-number
[
cpu
cpu-number
] ]
In IRF mode:
display
process
log
[
chassis
chassis-number
slot
slot-number
[
cpu
cpu-number
] ]
Views
Any view

