17 |
P a g e
Results Screen
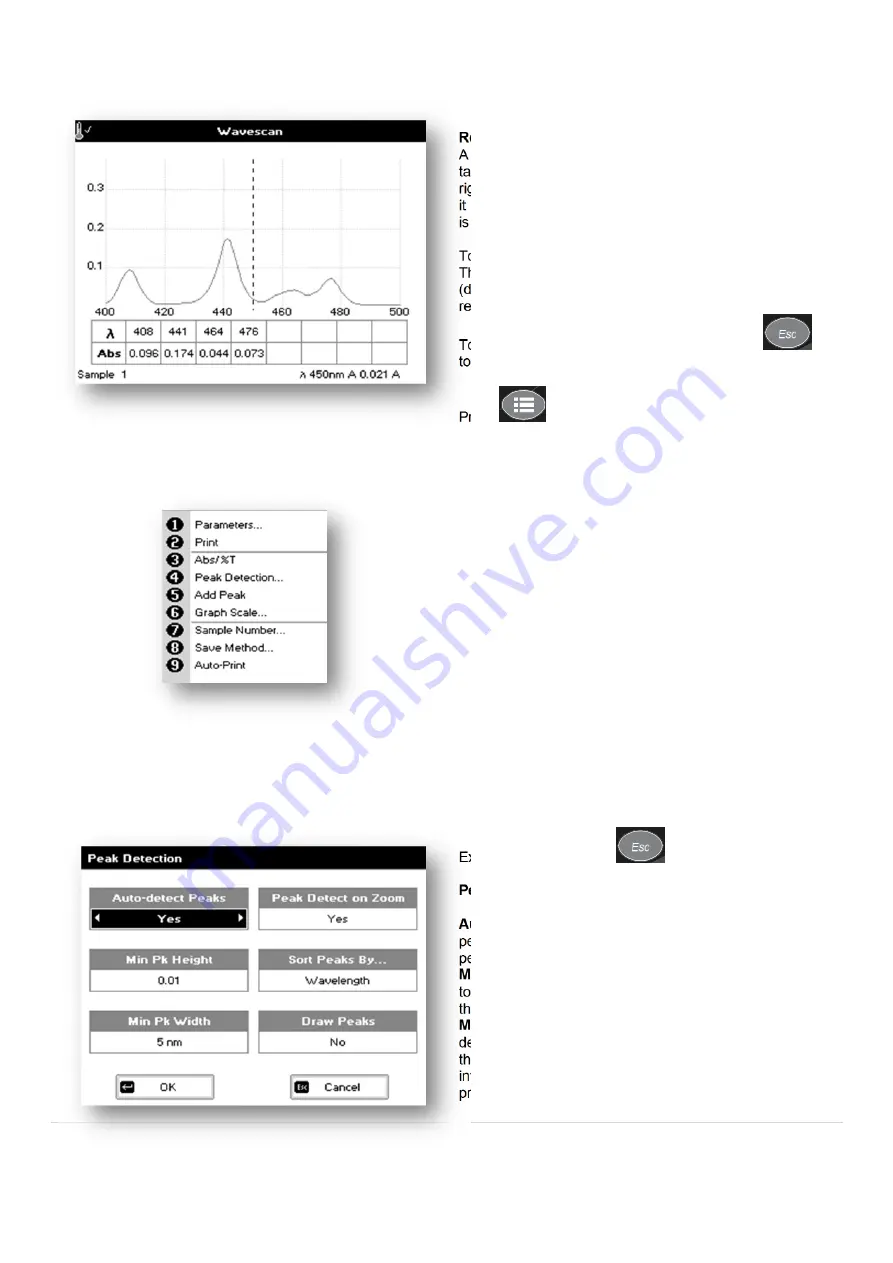
A graph of the wavescan is displayed, along with a
table of Absorbance/%T at each peak. Use the left and
right arrows to move the cursor along the graph. When
it reaches a peak the peak height and width of the peak
is displayed at the top of the screen.
To zoom in on the wavelength scale, use the up arrow.
This auto-scales on the Absorbance/%T scale
(dependent on the Graph Scale option) and this is
retained for subsequent measurements.
To zoom out again, use the down arrow. Press
to return to the Applications Folder.
Press
to display available Options.
Options
(select using key pad numbers)
1.
Return to parameters screen (step 1 above).
2.
Print result via selected method.
3.
Toggle between Absorbance and %T mode.
4.
Displays Peak Detection Parameter Screen.
See
description below.
5.
Manually adds a peak position to the peak table in
the results screen at the position set by the cursor.
If the cursor is returned to this position the legend
“User Defined Peak” is displayed at the top of the
scan and this option changes to Delete Peak
6.
Displays Graph Scale Parameter Screen.
See
description below.
7.
Sample number – add a prefix to the sample
number and reset the incrementing number to the
desired value.
8.
Save method – use the left and right arrows to
select a folder to store in (Favourites/Methods 1-9),
press the down arrow and enter name.
9.
Auto-print – toggles auto-print on/off.
Exit options by pressing
or wait.
Peak Detection (Shortcut Button 4):
AutoDetect Peaks:
Turns on and off the automatic
peak detection. The following options determine how
peaks are detected.
Minimum peak height:
Minimum height the peak has
to be above the higher of the two adjacent minima for
the peak to be detected.
Minimum peak width:
Minimum width of the peak as
determined by the difference in wavelength between
the higher of the two adjacent minima and the opposing
intersection of that higher minimum level and the peak
profile.


