19
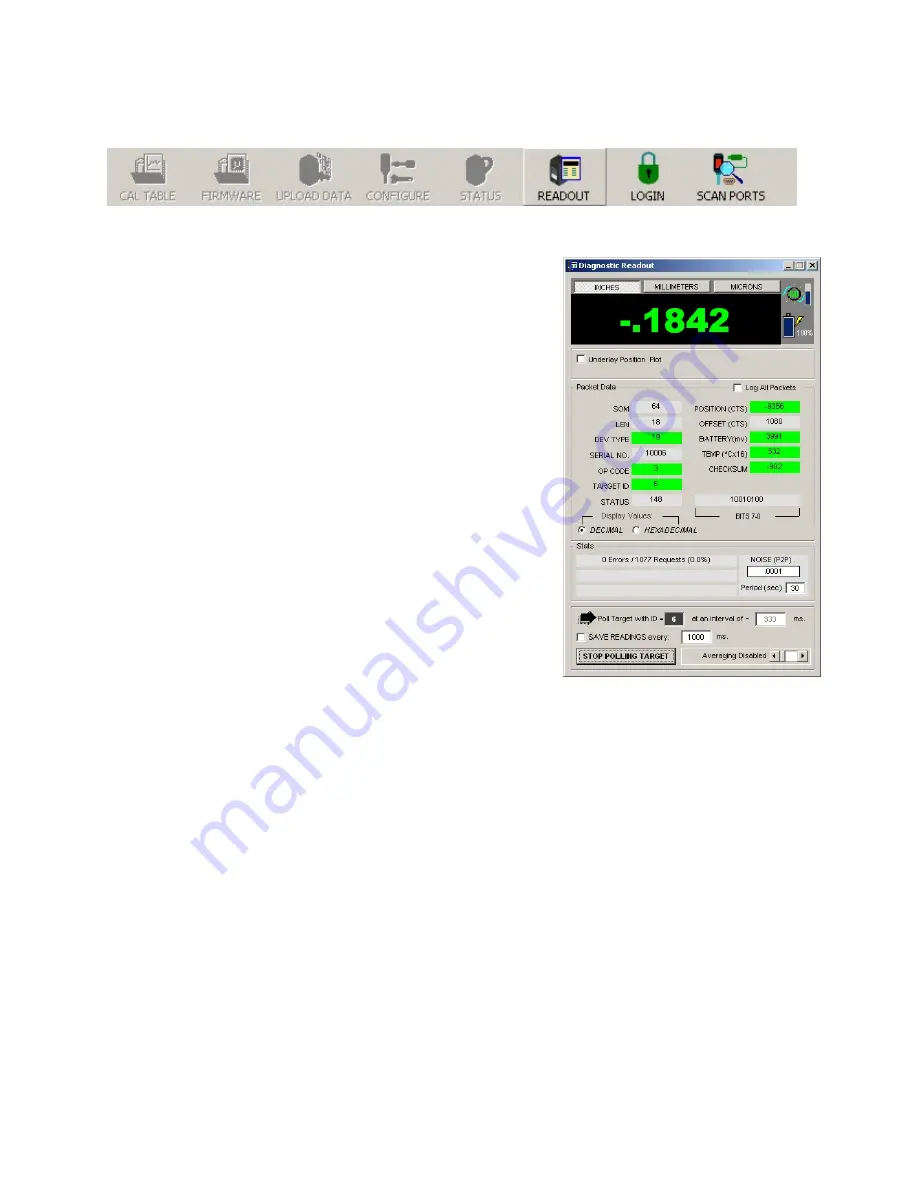
Diagnostic Readout – Normal Application Mode
Figure 33 –
Menu Buttons for Normal Application Mode
1.
Set the target to Normal Application Mode (see Figure 32).
2.
When the menu buttons for Application Mode display, (see
Figure 33) click
READOUT
to display the Diagnostic Readout
window (see Figure 34).
Using the Diagnostic Readout Window
Top
•
UNITS selection buttons (inches, millimeters or microns)
•
To the right of the position display window:
_
The Periodicity Sync indicator
_
The Incident Light Level bar
_
The Battery Charge indicator.
Center
Packet data:
•
Green fields indicate normal values
•
Yellow fields indicate caution (values are borderline normal)
•
Red fields indicate abnormal values
Bottom
•
Communication Error Statistics
•
Peak Noise (peak-to-peak) over the specified period
•
Network ID of target being polled for data
•
The polling interval
•
External averaging
•
Data saving (refer to
Diagnostic Readout – Advanced Functions
on Page 21).
Zeroing the Display
•
To zero the live display, double click anywhere in the black display area.
Figure 34 –
Diagnostic Readout, Normal Application Mode


