19
Optima 310
6. Connecting to a PC
6.1 Function description of
data logger
The data logger software is for configuring and monitoring
Genvex devices. The hardware part of the data logger
is required if you want a connection to the device. The
data logger can only be connected to Optima 180, 200,
250, 300 and 310. The guide assumes a correct and
functioning set-up of the software. See any installation
guide for the software.
The user interface in Genvex data logger
The data logger can be used for several purposes.
Settings for parameters in the control system.
•
Setting up and changing the clock program in the
•
control system.
Reading of the data logger in the control panel for the
•
past 6 years.
A “Live” logging of the device’s current operation.
•
Subsequent analysis of a device’s operation
•
User interface
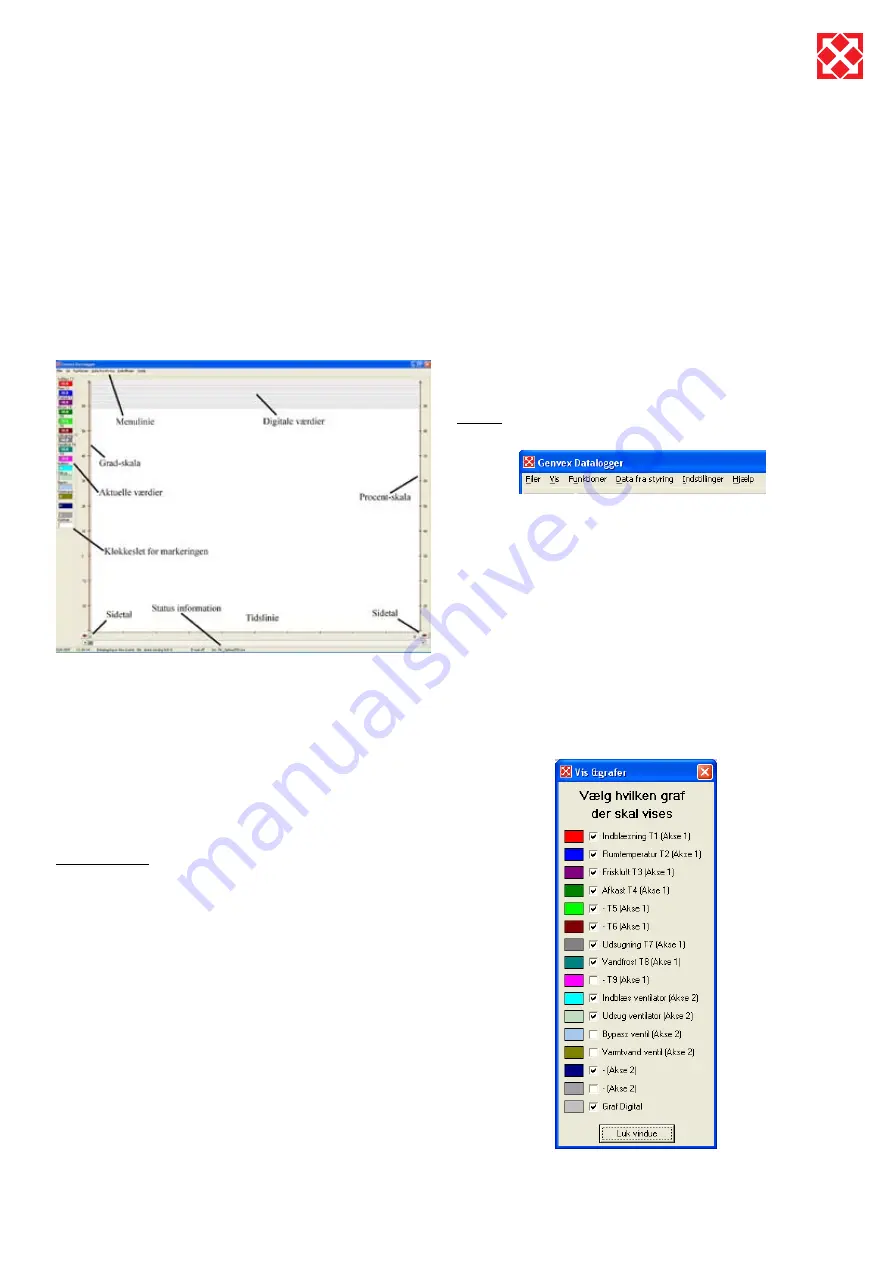
The program is constructed with the primary picture in
the centre of the screen where the graphs are shown
that represent the information that is collected from the
control system. At the top is the menu line for the various
settings.
On the left side is shown the values that are read either
“here and now” or the values that lie underneath the red
line. The red line appears when you click on a random
location on the display. The figures in the left column
will then be all of the values that lie below the line. The
colours of the graph in the logging area correspond to
the colours shown on the left hand side. The exact time
of the logging will be displayed in the field at the bottom.
Tip: Click on the field for the clock to change the field to
display “LOG NO.”. This can be useful if you want to refer
to all of a specific logging. At the top of the actual logging
area on the screen there is an area with grey and white
lines. These lines will be red if an exit or function is active.
Hold the mouse cursor over the line for a moment and
a small help text will appear. The left side of the logging
area is a scale for temperatures. The right hand side of
the logging area is the scale for percentages e.g. for the
fan speed. The bottom represents the time-line. A logging
can contain a number of pages and a there will therefore
be a page number in the bottom corners of the logging
area. Change the page by clicking on the red arrow.
Hold down the left mouse button for a moment over the
red arrow to bring up a dialogue box. You can enter the
page number you wish to scroll to here.
The status menu is at the bottom of the page. This line
shows the date and time, whether the data logging is
started or stopped and the control to which the software
is configured (Can be changed in “Settings”).
Menus
Files:
Retrieve data – Retrieves data saved earlier on the hard
disc
Saves data – Saves the current logging
Save window – Saves only the current window
Print – Prints the current window
Terminate – Terminates the software
View:
View graphs – Opens a check-box that gives the
possibility to select or deselect the graphs shown on the
screen. This is often to provide an overview.
Summary of Contents for Optima 310 DESIGN
Page 1: ...Version V1 02 0209 UK User Manual Optima 310 DESIGN ...
Page 26: ...26 Optima 310 ...
Page 27: ...27 Optima 310 ...


