background image

Basic Sound Chamber Tests 

79

8.  Use [

∧, ∨

] to change the intensity of the magnetic field. The choices are: 

OFF, 1.00, 1.78, 3.16, 5.62, 10.0, 17.8, 31.6, 56.2, and 100 mA/m. 31.6 is the 
default source intensity.

9.  Press [STOP] to stop the measurement or continue to test, as desired.

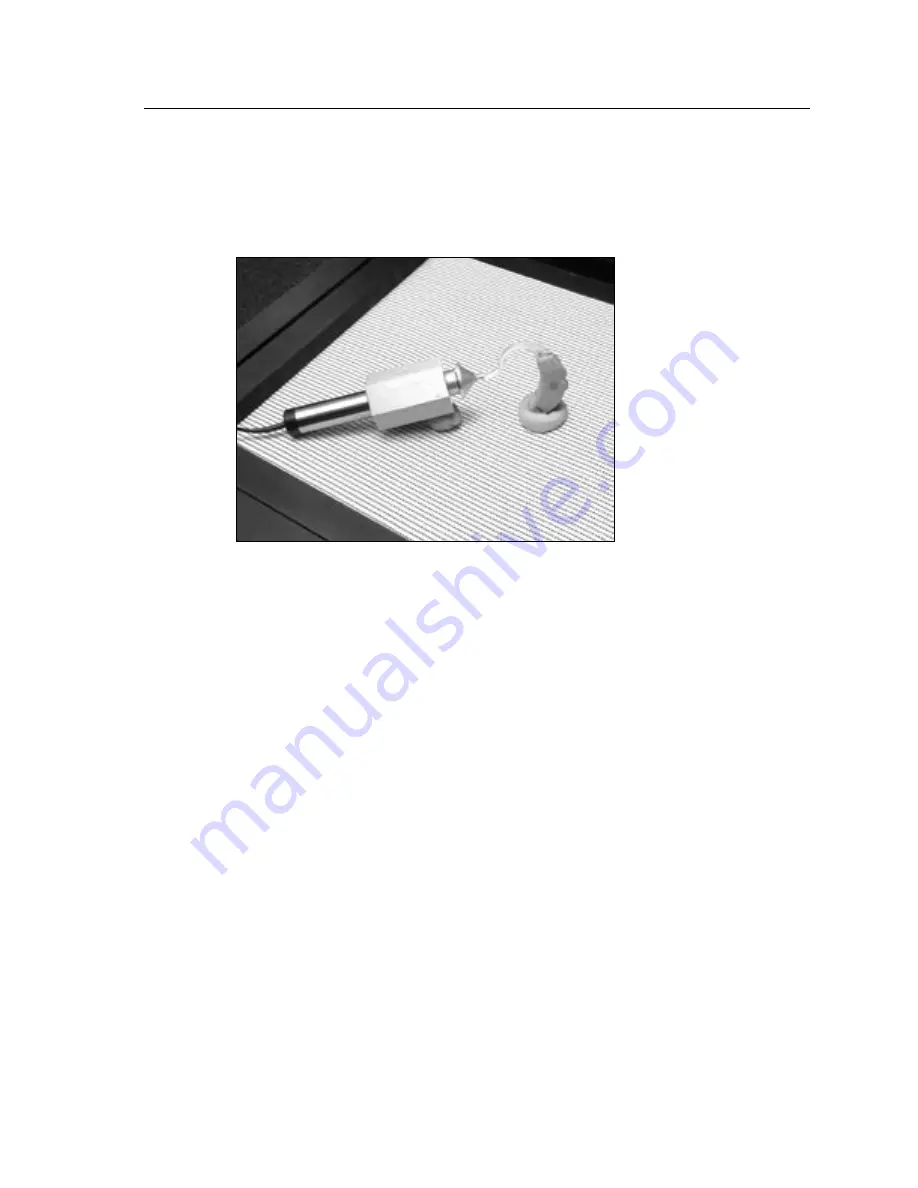
Figure 3.4.10A—Testing with the Sound Chamber Telecoil Board

Testing with the Telewand

When the ANSI Option is ordered with the 7000 Hearing Aid Test System, the 
Telewand device is also included. Otherwise, you can order it from the factory 
as an optional accessory. The Telewand is supposed to provide a more realistic 
test of the telecoil features of a hearing aid than the built-in telecoil board in 
the sound chamber because it more closely simulates the magnetic field pro-
duced by a telephone receiver.

1.  Follow steps 1-5 in the section above.
2.  Hold the hearing aid in one hand and the Telewand in the other hand. 

Position the Telewand as you would position the receiver of a hearing aid. 
That is, hold the Telewand a few millimeters next to the hearing aid, posi-
tioned parallel to the body of a BTE aid or against the faceplate of an ITE 
aid.

3.  Look at the RMS OUT in the Curve Characteristics box. This shows the cur-

rent output of the hearing aid to the magnetic field input.

4.  Position the hearing aid (with the Telewand held against it) for maximum 

output. For BTE hearing aids, this usually occurs when the body of the aid 

Summary of Contents for FONIX 7000

Page 1: ...Hearing Aid Test System Operator s Manual Version 1 51 2006 Frye Electronics Inc All rights reserved Oct 23 2006 FONIX 7000 ...

Page 2: ......

Page 3: ... 1 7 Maintenance 19 1 7 1 Cleaning 19 1 7 2 Care Maintenance of your M1950E Coupler Microphone 20 1 7 3 Locating the serial number and software version 20 1 7 4 Contacting the Factory 22 1 7 5 Warranty 22 Chapter 2 General Operation 2 1 Operation of buttons 23 2 1 1 Using the function keys 23 2 1 2 Navigating through the screens 25 2 1 3 Using the pop up help windows 26 2 1 4 Using the local menus...

Page 4: ...ge 49 2 5 Display Data 49 2 5 1 Viewing the Curve Characteristics Box 49 2 5 2 Viewing numerical data 51 2 6 Computer Connection 52 2 7 Remote Module 52 2 8 Leveling 53 Chapter 3 Basic Sound Chamber Tests 3 1 The Coupler Screen Display 55 3 1 1 Viewing a Pure tone Display 55 3 1 2 Viewing a Composite Display 56 3 2 The Leveling Process 57 3 2 1 Leveling the sound chamber 57 3 2 2 Removing the leve...

Page 5: ...8 Automatic Testing Loading Saving Groups 91 3 8 1 Setting up a test sequence 92 3 8 2 Loading a Saved Test Sequence 93 3 8 3 Testing in Fully Automatic Mode 93 3 8 4 Testing in Semi Automatic Mode 93 3 9 Complete List of Menu Items 94 Chapter 4 Advanced Coupler Tests 4 1 Enhanced DSP 97 4 1 1 Digital Processing Delay 97 4 1 2 Signal Phase 98 4 1 3 Procedure 99 4 2 Battery Current Test 100 4 2 1 S...

Page 6: ...5 Chapter 6 Real Ear Measurements 6 1 Introduction 127 6 1 1 Understanding the Real Ear Screens 127 6 1 2 Navigating through the Real Ear Screens 128 6 2 Real Ear Setup 128 6 2 1 Placing the Sound Field Speaker 128 6 2 2 Placing the earhook and reference microphone 129 6 2 3 Inserting the probe tube 130 6 2 4 Leveling the Sound Field Speaker 133 6 2 5 Setting up Body Aids 135 6 3 Real Ear Targets ...

Page 7: ...e 160 6 6 2 Determining the null 162 6 7 Open Ear Hearing Aids 162 6 8 Visible Speech 163 6 8 1 Performing Visible Speech measurement 164 6 8 2 Viewing the Real time Visible Speech Display 165 6 8 3 Viewing Completed Test Results 165 6 8 4 Measuring multiple envelopes 166 6 9 CROS BICROS Aids 167 6 9 1 Measuring the Head Baffle Effect 168 6 9 2 Measuring the Overcoming of the Head Baffle Effect 16...

Page 8: ......

Page 9: ...gy evolved The original 6500 operator interface was originally designed around a set of tests that were needed at the time of its introduction Linear and AGC hearing aids were tested for ANSI coupler performance and real ear tests were done to check on insertion gain performance Its Composite signal gave the industry the first real time interactive frequency response measurement for both coupler a...

Page 10: ... aids Battery Current as a function of amplitude and frequency I O Curves Attack and Release For both composite and pure tone measurements the following are possible Special CIC hearing aid coupler measurements Behind the ear BTE In the ear ITE in the canal ITC Open ear and body hearing aid measurements Choice of either IEC 60118 7 or ANSI S3 22 2003 96 87 92 standard tests All tests can be instal...

Page 11: ...ich is used for performing ANSI 96 telecoil measurements IEC Option The IEC Option gives the user access to the IEC test sequence which performs measurements in accordance with the IEC 118 7 the performance part of the IEC standard OES Option The Occluded Ear Simulator OES Option includes the MZ 1 MZ 2 and MZ 3 couplers and corresponding correction factors meant to simulate the results of a real e...

Page 12: ...for testing in the ear aids canal aids and aids fit ted with earmolds 1 4 Accessories The following are accessories that are standard and optional on your FONIX 7000 hearing aid analyzer 1 4 1 Standard Accessories The following accessories come standard with each 7000 test system Ear Level Adapter BTE Snaps into the 1 4 6 35 mm diameter cavity of the HA 2 and MZ 2 couplers Equipped with a 0 6 15 m...

Page 13: ...ble Connects the main module to the test chamber Battery Substitution Pills Used to power hearing aids measure battery drain and estimate battery life Standard sizes 675 76 13 312 10A 230 Other Standard Accessories Thermal Paper Fun Tak RS232 Cable Dummy Microphone for testing to ANSI specifications Sound Chamber Replacement Feet Operator s Manual Maintenance Manual upon request at time of purchas...

Page 14: ...luded Remote Module and Microphones The remote module allows the user to control the analyzer while remaining close to the patient The probe and ref erence microphones used for perform ing real ear measurements are plugged into this module Sound Field Speaker Produces the output for most real ear measurements The Real Ear Option can be ordered with a floor stand remote module shelf or with a swing...

Page 15: ...r to listen to the signal being measured by the probe micro phone Model of headset may differ from one shown Wedge style Ear Hook Standard Size Holds probe and refer ence microphone during real ear test ing Probe Tubes Used for performing real ear measure ments Probe tubes are not reusable ...

Page 16: ... software correc tion factors 6 cc Coupler Enables checking the response of stan dard audiometer headphones It is designed around the NBS 9A coupler specifications MZ Couplers MZ 3 MZ 2 and MZ 1 couplers are supplied with the OES Option 1 4 3 Optional Accessories Infant Child Headband Includes infant child and adult head bands six bendable earhooks and two sets of animal ears ...

Page 17: ...r many CIC hearing aids Also available 41 battery pill AA Sound Level Calibrator A portable self contained field type calibrator for calibrating the microphone amplifier It operates on one nine volt transistor battery Use with 14 mm to 1 adapter Calibration is traceable to the U S National Institute of Standards and Technology Conforms to ANSI 1 40 1984 and IEC 942 1988 ...

Page 18: ...pen it the rest of the way Great when performing repetitive coupler measurements FM Kit Facilitates coupler and real ear tests of FM systems The kit includes a telescoping floor stand with a test plat form and plenty of extra Fun Tak and a 6 inch 15 cm square foam pad for using the 2 cc coupler outside the test chamber Sound Chamber Stand A secure steel tube stand that improves sound isolation and...

Page 19: ...st system A wide internal ther mal printer is located to the right of the front panel See Figure 1 5 1 POWER STANDBY Figure 1 5 1 Front panel FUNCTION KEYS The top row of buttons on the 7000 front panel consists of function keys labeled F1 through F8 The function of these keys change from screen to screen according to the need of the screen There are three basic uses of the function keys RECD Earp...

Page 20: ...fault Settings menu EXIT Exits from the current screen leaving all settings measure ments and test conditions as is LEVEL Levels the sound chamber or sound field speaker FEED Advances the internal thermal paper feed PRINT Prints current screen STOP Stops testing START Starts testing ARROW KEYS The arrow keys perform different functions depending upon the screen and previous buttons pushed In a tes...

Page 21: ... measure ments 3 EARPHONE Connect a insert earphone to the analyzer for RECD mea surements A 50 ohm earphone should always be used to avoid harm to the earphone 4 SOUND CHAMBER Connects the main module to the sound chamber 5 RS232 Connects the 7000 test system to a personal computer 6 RS232 LEDs The red LED indicates the analyzer is sending a poll This will flash whether or not a computer is conne...

Page 22: ...contact Frye Electronics Inc or your Frye representative This symbol indicates that Frye Electronics Inc conforms to the Medical Device Directive 93 42 EEC Any attached video monitor external printer or external computer should also have a CE mark in order for the 7000 test system to remain compliant Replace fuses only with the same type and rating 1 5 3 Safety Safety Classification for IEC 60601 ...

Page 23: ...ency energy In some cases the 7000 could cause interference to radio or television reception You can determine if the 7000 is the source of such interference by turning the unit off and on If you are experiencing interference caused by the 7000 you may be able to cor rect it by one or more of the following measures 1 Relocate or reorient the receiving antenna 2 Increase the distance between the 70...

Page 24: ...he ISO 13485 standard 1 6 Setup This section describes the unpacking and setup of the 7000 test system A description of the front and back panels is also included 1 6 1 Unpacking the FONIX 7000 Remove the FONIX 7000 test system from the shipping cartons Store the ship ping cartons in a dry place so that they can be used again in the event that the unit must be returned to the factory for repair or...

Page 25: ...lts 1 6 3 Connecting the Main Module Components Connect the main module to the system components as follows see Figure 1 6 3 1 Connect the video monitor to the jack marked Monitor on the back of the main module Tighten the screws on the connector to secure the connection 2 Plug the M1950E microphone into the connector marked Microphone located on the back of the main module 3 Connect the sound cha...

Page 26: ...pending T630 mAL Earphone Speaker External printer not provided Monitor Headphones Computer not provided Telecoil board optional Telewand optional 7020 Sound Chamber Quik Probe remote module M1950E Microphone Probe Reference mics Figure 1 6 3 7000 test system setup 1 6 4 Connecting the Real Ear Equipment If you ordered the Real Ear Option connect the real ear equipment as follows See Figure 1 6 3 ...

Page 27: ...displayed It contains the FONIX logo along with the software version the serial number and the avail able options This information is important in identifying your equipment when you communicate with the company about your FONIX 7000 test system 1 7 Maintenance In order to ensure accurate testing we recommend yearly calibrations of your coupler microphone For those units with the Real ear Option w...

Page 28: ...n t pull the microphone from the coupler by the cord When removing the microphone from the coupler grip the microphone body not the cord Pulling on the cord damages the connection 4 Don t get Fun Tak on the grill of the microphone Fun tak that accumulates on the grill will fall into the microphone body and onto the diaphragm which will damage the microphone 5 Don t touch the diaphragm of the micro...

Page 29: ...000 test system can be found on the Opening screen See Figure 1 7 3B Press HELP to open a help window with more detailed service information This data may be requested if you call in with a repair related question Press HELP again to close the help window Figure 1 7 3B Software version location ...

Page 30: ...3391 9826 SW Tigard St Tigard OR 97281 3391 Tigard OR 97223 USA USA Phone 800 547 8209 or 503 620 2722 Fax 503 639 0128 Email sales frye com sales questions Support frye com technical questions Service frye com repair questions 1 7 5 Warranty The 7000 test system and its accessories are guaranteed to be free of manufac turing defects that would prevent the product from meeting its specifications g...

Page 31: ... the function buttons the arrow buttons and the Menu Help Reset Exit Level Feed Print Stop and Start buttons 2 1 1 Using the function keys The top row of buttons on the 7000 test system front panel consists of function keys labeled F1 through F8 The function of these keys changes from screen to screen according to the need of the screen The screen itself always shows the function of each of these ...

Page 32: ...le between those options For example a function key setting the ear tested will toggle between left and right A red box will appear briefly around the function key box on the dis play This box means that the selection is in the process of being toggled Pop up Menu In a measurement screen when there are several possible selections to be made with a function key pressing the function key will bring ...

Page 33: ...en Some of the screens will only be available to you if you ve ordered a certain option F1 F2 F3 F4 F5 F6 F7 F8 JIS Enhanced DSP F1 F2 F3 F4 F5 Audiogram Target Insertion Entry Edit Gain SPL ANSI 87 ANSI 96 ANSI 03 Battery Coupler Attack Test I O Release OPENING SCREEN ANSI S3 42 Other Tests IEC ANSI S3 22 Coupler Real Ear Screen Menu F1 F2 F3 F1 F2 F3 Visible Speech Figure 2 1 2 Navigation Flow C...

Page 34: ... system has a local help window designed to give you a basic operational overview of the current screen In gen eral these help windows tell you what each button does in the current screen See Figure 2 1 3 for an example To clear the help window press HELP again or the EXIT button Figure 2 1 3 Pop up help window ...

Page 35: ... menu will usually carry across any other local menu containing that selection For instance AID TYPE is a common selection in the local menus of the Coupler and Insertion Gain screens If you were to set the AID TYPE to AGC in the local menu of the Coupler screen it will automati cally be set in local menu of the Insertion Gain screen HINT Located between each option and its selection in the local ...

Page 36: ...L Levels the sound chamber or sound field speaker See Sections 3 2 and 6 2 4 for details FEED Advances the internal thermal printer paper PRINT Prints the current screen See Section 2 4 for details STOP Stops a currently running test START Starts a test ARROW KEYS The arrow keys perform different functions depending upon the screen and previous buttons pushed In a test situation they adjust the so...

Page 37: ...he saved setup number will automatically be selected as the current user To load a setup configuration 1 Open the Setup menu by pressing MENU from the Opening screen 2 Press F7 to open the Load Setup Defaults pop up window 3 Use to select the desired setup number 4 Use to complete the selection and close the pop up menu Whenever a user configuration is saved or loaded that user will also be auto m...

Page 38: ...for printouts Choose INTERNAL or EXTERNAL See Section 2 4 EXT PRNT COLOR Color used when an external printer is selected Choose BLACK WHITE or COLOR EXT PRNT LANGUAGE Language used when the external printer is selected Choose HPCL or EPSON EXT PRNT SCRNS PAGE The number of screens printed on a page using an external printer See Section 2 4 7 RS232 BAUDRATE Baud rate of the RS232 connection This is...

Page 39: ...he hearing aid being tested Used in battery current measurements COUPLER TYPE The type of coupler being used in making sound chamber measurements Selections of CIC and MZ turn on corresponding software cor rection factors see Sections 3 6 and 3 7 A selection of NONE or 2cc does not apply correction factors to the curve DISPLAY Display of the Coupler Multicurve screen Choose between Gain and SPL Re...

Page 40: ...al ear measurements A selec tion of AVG will set the KEMAR average A selection of CUSTOM will use the patient s measured unaided response IG DISPLAY Type of display used in the Insertion Gain screen Choose between having the lower graph display in gain or SPL output TONE FILTER The weighting used for pure tone sweeps in real ear measure ments FLAT produces tones at each frequency with the same amo...

Page 41: ...ANSI and ICRA The type of signal you should choose for a particular test or type of hearing aid depends upon the situation Here is a description of each of the source types and when you would want to use them 2 3 1 Understanding Pure tone Signals A pure tone sweep is a test involving a progression of pure tone signals pre sented at a specified level When the sweep is complete the aid s frequency r...

Page 42: ...tortion measure ments equivalent input noise and single frequency telecoil measurements See Section 2 3 1 3 MISC MEAS DELAY The amount of time each subsequent tone is presented before the measurements is made in one of the measurements listed above See Section 2 3 1 3 I O START DELAY The amount of time the first tone in an I O sweep is pre sented before the measurement is made See Section 2 3 1 3 ...

Page 43: ...han others to adjust to changes in amplitude or frequency If the measurement is made too quickly an artifact in testing will be created If the measurement takes too long the test is longer than necessary In determining the length of time needed for a proper measurement a good rule is to use twice the published attack time of the hearing aid If you are unsure of the attack time you can experiment w...

Page 44: ... will have some amount of distortion Usually the strongest artifacts occur at the second and third harmonics of the frequency With the 7000 Test System you can test the amount of distortion available in the second harmonics the third harmonics or both harmonics considered total harmonic distortion Definitions 2nd Harmonic Energy of the second harmonic or twice the presented frequency 3rd Harmonic ...

Page 45: ... emphasis than the high er frequencies The Composite signal is both a faster and a more realistic signal than a pure tone sweep because there is no waiting for a progression of tones to complete and like speech a broad spectrum of frequencies is used simultaneously The Composite signal updates several times a second Digital Speech is an interrupted version of the Composite signal used for test ing...

Page 46: ...gether several of the previous measurements with the cur rent measurement to produce the next curve If you select 2X noise reduc tion it will average the last two measurements together A selection of 4X averages the last four measurements together When performing composite mea surements it will take several seconds for the actual noise reduction used to reach the set value This is due to the natur...

Page 47: ...h frequen cies at a rate of 6 dB per octave starting with a 3 dB drop at 900 Hz The ICRA filter uses the ICRA speech spectrum developed by the International Collegium of Rehabilitative Audiology The ICRA spectrum is based on the Long Term Average Speech Spectrum LTASS and rolls off the high frequencies more rap idly than the ANSI spectrum Figure 2 3 2 3 shows a comparison of the spectra In general...

Page 48: ...ntical The Standard Composite signal is composed of 79 different individual frequen cies that are each generated with a random phase pattern that results in the signal having a crest factor of 10 dB close to the crest factor of human speech If the phase components were not randomized or otherwise changed and if all the signal components were in phase the crest factor of the signal would increase t...

Page 49: ...signal and its Digital Speech counterpart is a complex signal consisting of 79 different frequency components When you set the source level of a composite signal 50 dB 60 dB etc you are actually setting its overall energy known as the RMS root mean square of the signal you are NOT set ting the amplitude of the individual frequency components The actual amplitude of each of frequency of the Composi...

Page 50: ...tings are STANDARD linear 20 ms AGC 100 ms ADAPTIVE 2000 ms The signal off time is random between 100 and 300 milliseconds This time is not controllable by the user 2 4 Printing The 7000 test system comes equipped with an internal thermal printer The thermal printer prints a clear easy to read image of the display You can also hook up an external printer to print your results on normal office pape...

Page 51: ...n the Setup menu 7 Press EXIT to return to the Opening screen 2 4 2 Adding a label A label with your printout allows you to record useful information about the client and hearing aid to go along with the test results See Figure 2 4 2 If you are in the middle of a test and you want to add a label for the printout in the local screen without changing the default setting 1 Press MENU from the measure...

Page 52: ...printer for any residue or foreign matter and clean as required Paper residue or foreign matter may shorten the life of the thermal printer head or platen The 7000 printer mechanism is equipped with a paper back tension device This feature is used to eliminate paper migration from side to side If paper migrates too far to one side the edge or the paper will krinkle and cause a paper jam The white ...

Page 53: ...h the 7000 printer contact the factory Section 1 7 4 and be ready to provide the Frye technician with the error code The printer software version available in the help menu of the Opening screen will also be helpful 2 4 4 Loading the thermal paper Please read the entire instructions before loading paper Refer to Fig 2 4 4A for printer features Step I Installing the paper into the printer assembly ...

Page 54: ...ter 1 Turn on the instrument 2 Place the Head Up lever into the up position See Fig 2 4 4B 3 Unroll approximately six inches of paper from the roll and insert the paper s leading edge into the bottom of the printer directly behind the rub ber roller See Fig 2 4 4C Figure 2 4 4B Head Up lever in up position ...

Page 55: ...nto the down position 7 Please read the caution note below before proceeding Press the FEED button to advance the paper Continue pressing it until the paper advances smoothly The back tension device should automatically correct a misaligned paper feed If the paper is not aligned properly it may krinkle on one edge If the paper continues to krinkle after feeding 12 inches place the Head Up lever in...

Page 56: ...behind the rubber roller 3 Push the roll of paper back and up then lift out 2 4 6 Using an external printer You can hook up an external printer to your 7000 test system to print your results on normal office paper This eliminates the problem of fading associated with thermal printouts and often makes it easier to store your test results You can use any external printer that supports HP PCL Hewlett...

Page 57: ... on the second half of the paper or run another test 7 Press PRINT to print the second screen and feed the paper the rest of the way through the printer Note if you decide you don t want to take a second screen shot press FEED to feed the second half of the paper through the external pritner without printing 2 5 Display Data This section describes the Curve Characteristics Box that is common to ev...

Page 58: ...HTL hearing threshold level UCL uncomfortable level Source Type This identifies the type of source used to make the curve Each curve is identified by three letters First letter C Composite P Pure tone D Digital Speech Second letter For pure tone N Normal pure tone F Fast pure tone S Short pure tone For Composite or Digital Speech W Weighted composite F Flat weighted S Spectrum Third letter P SPL m...

Page 59: ... is partially off the graph in both directions 2 5 2 Viewing numerical data You can display the numerical data of the response curves made in the Coupler screen and the real ear measurement screens To display numerical data 1 Press MENU from the Coupler screen or real ear measurement screen 2 Select Data Graph using 3 Use to select DATA 4 Press EXIT to return to the measurement screen 5 Use F2 to ...

Page 60: ...erforming real ear measurements The keys of the remote module are a sub set of the keys of the front panel of the main module This means all functions performed with the remote module can also be performed in the same way with the front panel Since there are only five function keys on the remote module and eight function keys on the main module there will be some operations particularly in coupler...

Page 61: ...ils on the leveling status messages UNLEVELED Leveling has not been attempted and sound is uncorrected LEVEL_ERROR or LEVEL_FAILED An error happened during leveling and source is uncorrected LEVELED Leveling has been achieved within 0 25 dB between 260 6000 Hz and 0 5 outside that frequency range for sound chamber level ing or within 1 dB between 260 6000 Hz and 2 dB outside that fre quency range ...

Page 62: ...ote module and sound field speaker If you have been able to successfully level the sound field speaker in the past the most likely problem is the reference microphone needs calibration or is damaged although sound field speakers have also been known to go bad Sound field leveling however is more prone to user error than sound chamber leveling Make sure the sound field speaker isn t pointed at a wa...

Page 63: ...enter the Coupler screen by pressing F1 The Coupler Multicurve screen can be set as the screen that appears when the 7000 test system is powered or the RESET button is pressed See Section 2 2 1 and 2 2 4 Other sub section for details 3 1 The Coupler Screen Display The display of the Main Coupler Screen varies depending upon whether you have chosen a pure tone source or a composite including Digita...

Page 64: ...lected noise reduction 6 Maximum output and three frequency average of the selected curve 7 Source Signal Statistics Box Displays the source amplitude frequency dis tortion and output gain 3 1 2 Viewing a Composite Display Figure 3 1 2 Coupler screen with a Composite source Refer to Figure 3 1 2 for the following explanation of the graphical display 1 Type of display This will be either dB SPL cou...

Page 65: ... chamber Even if the screen says LEVELED the response of the measurement microphone may have altered since the analyzer was last leveled invalidating the leveling When in doubt level the sound chamber again See Section 2 8 for details on the leveling status and troubleshooting the level ing process 3 2 1 Leveling the sound chamber To level the sound chamber 1 IMPORTANT Be sure nothing is plugged i...

Page 66: ...unleveled status the analyzer will revert to its leveled status after it has been turned off and on again 3 2 3 Saving the leveling information To save the sound chamber leveling so that you won t have to re level the sound chamber the next time the analyzer is turned on 1 Follow the instructions in Section 3 2 1 to level the sound chamber 2 Press MENU from the Opening screen This will open the Se...

Page 67: ...imulates the earmold Button type receivers connect directly to this coupler Behind the Ear BTE hearing aids connect to this coupler by means of an ear level adapter as shown in Figures 3 3 1C OUTER O RING INNER O RING MICROPHONE O RING Figure 3 3 1A Figure 3 3 1B Standard 2 cc Coupler HA 2 Direct access coupler HA 1 0 4 10 mm NUB CONNECTS TO TOP OF HA 2 COUPLER Figure 3 3 1C Ear level Adapter used...

Page 68: ...e reaches the O ring You must contin ue to push the microphone into the coupler past that first resistance or incorrect data will be collected 3 3 2 In The Ear ITE and Canal Aids 1 Roll the Fun Tak provided with each instrument into a rod long enough to go around the transmitting end of the aid approximately 2 inches Modeling clay can also be used but it doesn t work as well 2 Bend the Fun Tak rod...

Page 69: ...test cham ber With ITEs the position of the aid can affect the frequency response As a rule point the faceplate of the aid toward the right with the micro phone opening as close as possible to the reference circle It is best when possible to angle the faceplate upward instead of downward see the photo at left For the sake of repeatability you may elect to use a ninety degree angle of the faceplate...

Page 70: ...ght up with them At the moment there is no standardized method of performing a coupler mea surement on an open ear style hearing aid Hearing aid manufacturers have independently developed different mechanisms for attaching an open ear hear ing aid to an HA 1 or HA 2 coupler One such device pictured in Figure 3 3 4A is attached to the speaker unit of the open ear hearing aid and to the tubing of an...

Page 71: ... an attached hearing aid Figure 3 3 4A HA 2 Coupler Figure 3 3 4B HA 1 Coupler Figure 3 3 4C Open ear coupler Figure 3 3 4D contains an example of a comparison of an open ear hearing aid tested with an open ear coupler Curve 1 an HA 1 coupler attached to the open ear hearing aid with Fun Tak Curve 2 and an HA 2 coupler with an open ear attachment Curve 3 The dark line Curve 4 in the graph represen...

Page 72: ...ed by locating the 2 cc coupler outside the test chamber preferably on a foam pad to isolate it from vibration 2 Snap the earphone receiver of the body aid onto the 1 4 recessed end of the coupler Figure 3 3 5A 3 Place the aid in the test chamber with its microphone opening as close to the reference point as possible See Figure 3 3 5B 4 Turn the gain volume control to the desired setting and set t...

Page 73: ...g as shown in Figure 3 3 6 The length and thickness of the tubing have a significant effect on the fre quency response of an aid especially in the 500 to 1000 Hz region If an aid is being compared against the manufacturer s specifications the tubing should be carefully chosen to duplicate that used by the manufacturer to obtain the original data For ANSI tests use 0 6 15 mm of 13 thick walled tubi...

Page 74: ...he monitor back on to view results or push PRINT to print LCD monitors should not cause interference Wireless CROS A CROS Contra lateral Routing of Signal aid consists of a transmitter and a receiver so that sound received on one side of the head can be transmitted to the other side without a wire connection You can test these units in the test chamber of the FONIX 7000 Test System See Figure 3 3 ...

Page 75: ...ophones one on the transmitter side and the other on the receiver side 1 Test the receiver side as an ordinary hearing aid first 2 Arrange the transmitter parallel to the receiver but as far as possible from it while still in the chamber You may have to unscrew the ear hooks one quarter turn to accomplish this Fun Tak may help to keep the units in posi tion but be careful not to obstruct the sound...

Page 76: ...re separate units connected by a wire Both units may be placed inside the test chamber during testing 1 Place the orifice of the microphone unit at the reference position in the test chamber 2 Connect the amplifier unit to the appropriate 2 cc coupler See earlier sec tions for details 3 Place the coupler with the amplifier unit at the left side of the test area 4 Test as desired BICROS Test wire t...

Page 77: ...u information on the amplification of 43 different pure tone frequencies between 200 and 8000 Hz TONE FAST A continuous pure tone sweep that takes measurements at 16 different frequencies between 200 and 8000 Hz TONE SHORT A single pure tone sweep of 10 different frequencies 3 4 2 Running a Test Curve 1 Press MENU to make any necessary selections See Section 3 9 for details on available menu selec...

Page 78: ...ves provide progres sively less gain as the input rises then the aid has some sort of compression circuit Figure 3 4 3 shows two examples of this scenario Here are the steps 1 Look at the graph If it has a display of SPL press MENU and change the DISPLAY from SPL to GAIN using the arrow keys Press EXIT to return to the Coupler screen 2 Use F2 to select CRV 1 Press F2 Use to select CRV1 Press to co...

Page 79: ... of 70 dB SPL 11 Press START to run the third measurement Press STOP when the mea surement has stabilized 12 Use F2 to select CRV 4 13 Use to select a source level of 80 dB SPL 14 Press START to run the fourth measurement Press STOP when the mea surement has stabilized You now have a family of curves Figure 3 4 3A Family of curves Notice how all the curves are on top of each other This aid has ver...

Page 80: ...ess it there are four possible selections Selected Curve Delete only the selected curve but keep the curve selec tions usually source type and level Sel Curve Settings Delete selected curve and return curve to analyzer default setting All Curves Delete all curves but keep the curve selections All Curves Settings Delete all curves and return them all to analyzer default settings To delete a curve 1...

Page 81: ...ess EXIT to return to the Coupler screen The single tone will automati cally be running 5 Adjust the frequency using the buttons Adjust the amplitude using the buttons Figure 3 4 5 Measuring a single frequency 3 4 6 Running a Three Frequency Average The ANSI standard includes some three frequency average tests You can run a three frequency average test apart from the test sequence in the Coupler s...

Page 82: ...amplitude using the buttons Figure 3 4 6 Measuring a three frequency average 3 4 7 Measuring Harmonic Distortion Harmonic distortion is when the hearing aid returns energy at frequencies not present in the source signal The 7000 analyzer allows you test for this phe nomenon very easily 1 Press MENU from the Coupler screen 2 Select Distortion under Measurement Settings using the buttons 3 Select th...

Page 83: ... START to run normal frequency sweep After running a normal sweep the harmonic distortion data will appear on the measurement graph as a series of red bars The scale for the bars is on the right side of the graph In general you should ignore the harmonic distortion measurement when the amplitude of the response curve measurement at the second harmonic is more than 12 dB greater than the amplitude ...

Page 84: ...M distortion is disturbing to the client often more so than harmonic distortion When viewing a graph run with the composite signal look for points along the graph where the line breaks up Such an appearance indicates the presence of intermodulation distortion As IM distortion increases the curve becomes more disconnected See Figure 3 4 8 for an example of IM distortion This type of distortion is o...

Page 85: ... the appropriate battery button inside the sound chamber 3 Close the lid of the sound chamber and latch it 4 Press MENU in the Coupler screen 5 Use to select Battery Meas under Misc Settings You can use START to skip between groups of selections 6 Use to turn ON the Battery Meas 7 Use to select Battery Size and use to select the hearing aid s bat tery size 8 Press EXIT to return to the Coupler scr...

Page 86: ...g location and listen for raspy humming sounds from the hearing aid This will be the aid responding to magnetic fields in the room 5 Pick a location that is as free of such sounds as possible Rotate the aid in all directions when looking for a good site Testing with the Sound Chamber Telecoil board Every 7000 sound chamber has a built in telecoil board that can be used for telecoil testing 1 Set u...

Page 87: ...elecoil features of a hearing aid than the built in telecoil board in the sound chamber because it more closely simulates the magnetic field pro duced by a telephone receiver 1 Follow steps 1 5 in the section above 2 Hold the hearing aid in one hand and the Telewand in the other hand Position the Telewand as you would position the receiver of a hearing aid That is hold the Telewand a few millimete...

Page 88: ... test system cannot give you a polar plot of the directional hearing aid response but it can provide you with the basic informa tion of how much directional benefit the hearing aid wearer is receiving and at which frequencies The directional test takes advantage of the speaker placement in the large sound chamber and the flat testing surface that makes it easy to position the hearing aid for testi...

Page 89: ...st step in doing a directional test is to position the hearing aid in the sound chamber so that the front of the hearing aid is pointing towards the right side of the chamber See Figure 3 4 11B Close the sound chamber lid and per form the following steps 1 Enter the Coupler Multicurve screen by pressing F1 from the Opening screen 2 Use F5 to set the source type to Digital Speech 3 Use to set the s...

Page 90: ...mber lid when finished and perform the following steps 1 Use F2 to select the next curve 2 Use F5 to set the source type to Digital Speech 3 Use to set the source amplitude to 50 dB SPL 4 Press START When the measurement has stabilized press STOP The measured curve is the reverse measurement of the directional test If the directional microphones of the hearing aid are working properly this curve s...

Page 91: ...Basic Sound Chamber Tests 83 Figure 3 4 11C Reverse directional measurement Figure 3 4 11D Directional measurement screenshot ...

Page 92: ...ted signal as it would respond to nor mal speech 3 5 1 Using Digital Speech The 7000 analyzer seamlessly incorporates the testing of digital hearing aids into its normal testing procedures To test a digital hearing aid follow the steps outlined in Section 3 4 2 choos ing DIG SPEECH in Step 3 Digital Speech can be used to accurately test any hearing aid so if you aren t sure if the hearing aid is d...

Page 93: ...ignal CRV3 3 5 3 Testing with Bias Signals You can add a pure tone bias signal to the Digital Speech signal creating a con tinuous signal at the frequency of your choice This will allow you to see how the aid reacts to the presence of noise at different frequencies To add a bias sig nal 1 Select the DIG SPEECH signal with F5 in the Coupler screen 2 Press MENU to enter the local menu 3 Use to selec...

Page 94: ...veral different frequencies 3 5 4 Checking Noise Suppression When testing a digital hearing aid that is supposed to be programmed with a noise suppression or speech enhancement feature it is useful to make sure the feature is working correctly You can use a combination of Digital Speech and the Composite signal to test noise suppression 1 Look at the top left corner of the graph on the Coupler scr...

Page 95: ...plitude is the same as selected in Step 4 10 Press START to begin the measurement Leave the signal on for at least 15 seconds This should allow the noise suppression feature time to activate When the measurement has stabilized press STOP 11 Compare CRV 1 and CRV 2 If the curves are right on top of each other the aid is responding to the Digital Speech signal just as it would respond to the Composi...

Page 96: ...u are setting the amount of aver aging the analyzer does When you set Noise Reduction on your hearing aid you are usually setting the amount of noise reduction that the hearing aid does 3 6 CIC Feature The CIC Feature is a way of performing a coupler test of a CIC hearing aid that more accurately reflects the real ear performance of that aid than a regular 2 cc coupler measurement It is not a way ...

Page 97: ...URVE 2 uses CIC coupler correction factors CURVE 1 uses 2 cc HA 1 coupler 3 7 Occluded Ear Simulator Option The Occluded Ear Simulator OES Option consists of software correction fac tors and three special MZ couplers Together they allow you to simulate the data you would get with a standard ear simulator IEC 711 or Zwislocki coupler providing the hearing aid or mold being tested is not vented This...

Page 98: ...f the selected curve If you are using the FAST COMPOSITE or DIG SPEECH signal press STOP to end the measurement once it has stabilized See Figure 3 7 for a comparison of a BTE tested with an MZ coupler as opposed to a 2 cc coupler Table 3 7 Which is the Correct MZ Coupler to use TYPE OF AID COUPLER COMMENT ITE ITC MZ 1 BTE or EYEGLASS MZ 1 With custom earmold attached NOTE Vents must be plugged MZ...

Page 99: ...e levels noise reduction and other adjustments In automatic mode the analyzer will quickly run through all designated tests without pausing In semi automatic mode the analyzer will automatically advance to the next curve and stop This curve will not be measured until you start the test but you are saved the step of using F2 to select the next curve number Tests are programmed into the analyzer usi...

Page 100: ...ource level 7 Press MENU and use the arrow keys to select the desired noise reduction output transducer and composite type if desired Press EXIT to return to the coupler screen 8 Save and advance to the next curve This can be done two ways Press START if you want the analyzer to be programmed to automati cally advance to the next curve and start measuring it Press STOP if you want the analyzer to ...

Page 101: ...h allows the user to make adjust ments to the hearing aid before proceeding with the rest of the test sequence A programmed pause will be indicated by a horizontal line across the Curve Characteristics box 1 Load a test sequence You can do this by following the directions in Section 3 8 1 to create a new sequence or by loading a previously saved sequence by following the directions in Section 3 8 ...

Page 102: ...Complete List of Menu Items The function of all items in the local menu of the Coupler screen are described in this section Enter the local menu by pressing MENU in the Coupler screen Selections are made by using to choose an item and to change the setting There is a dotted or dashed line in between an item and its selection If the line is dotted the selection will only effect the Coupler screen I...

Page 103: ...en composite measurements or pure tone sweeps Choose AVG to emit a three frequency average between other measure ments Bias Tone Amplitude of the bias tone used with Digital Speech OFF turns off the bias tone entirely Composite Type Type of composite signal used Choose between STANDARD and CHIRP See Section 2 3 2 4 Composite Filter Filter used in Composite and Digital Speech measure ments Choose b...

Page 104: ... of the measurements listed above See Section 2 3 1 3 Misc Settings Battery Meas Status of the battery current measurement Choose ON or OFF Battery Size Size of battery used with the hearing aid being tested Print Label Status of the printing label Choose ON or OFF Printer Printer used for printouts Choose INTERNAL or EXTERNAL See Section 2 4 ...

Page 105: ...ime it s never instantaneous The processing delay for some hearing aids is so slight that it is imperceptible to the human ear The process ing delay for other aids can extend to several milliseconds Why is this a problem Well if you fit a client monaurally with an aid with a significant digital processing delay that person might experience some confu sion because his unaided ear will be hearing so...

Page 106: ...A second dotted vertical line shows the 7000 system delay for reference 4 1 2 Signal Phase The signal phase measurement is a test of the pushing and pulling of the amplified sound of the hearing aid Vibrations in the air create sound these vibrations can be thought of as air pushing and pulling against the ear If sound goes through a hearing aid the hearing aid might cause a phase shift turning a ...

Page 107: ... in the Opening screen to enter the Enhanced DSP screen 2 Set up the hearing aid for testing in the sound chamber See Section 3 3 Make sure the sound chamber is leveled 3 Use F1 to select the desired ear Figure 4 1 3 Enhanced DSP measurement results 4 Press START to perform the delay and phase tests for that hearing aid If the left ear was designated in Step 4 the results will be shown in the uppe...

Page 108: ...is test measures battery current drain as a function of amplitude This shows how the battery current varies as you present the hearing aid with different amplitudes To run these tests toggle the test status with F4 F5 and F6 respectively Pressing START will run the mA Freq and mA Ampl tests The tests will auto matically stop when finished The Static test is always on when its status has been toggl...

Page 109: ...ing aid Use to complete the selection and close the pop up menu 3 Use F4 to toggle the Static Tone to On The estimated battery life should now be displayed below the ma Freq graph See Figure 4 2 By default this test uses a pure tone stimulus of 1000 Hz at 60 dB SPL The current source selections are shown in a box below the mA Ampl graph on the right side of the screen You can Change the source Typ...

Page 110: ...e measured when Start is pressed Use F1 to switch between left and right ear Test results for each ear can be temporarily stored All data is lost when the analyzer is turned off or when the RESET button is pressed 4 2 3 mA Ampl The mA Ampl test shows how much battery current the hearing aid will drain when exposed to different input level A test very similar to the I O measure ment in the ANSI S3 ...

Page 111: ...zer is turned off or when the RESET button is pressed 4 3 Coupler I O The Coupler I O Test measures the input output of the hearing aid from 50 dB SPL to 90 dB SPL in 5 dB steps Test results are shown in both graphical format and numerical format and can be displayed in either Gain or SPL Output See Figure 4 3 To enter the Coupler I O screen press F5 Other Tests from the Opening screen Then press ...

Page 112: ...re the analyzer and the hearing aid for the test The second loud soft tones are used for the actual measurements The loud stimulus demonstrates the hearing aid s attack time That is how the hearing aid reacts to the test stimulus going from a soft level to a loud level The last soft stimulus demonstrates the hearing aid s release time That is how the hearing aid reacts to the test stimulus going f...

Page 113: ...NSI 96 This changes the test settings to those speci fied by the selected standard You can further customize the test settings by pressing MENU to open the local menu Use the arrow keys to make the desired adjustments and use MENU again or EXIT to close the menu See the Technical Details section below for more information In addition to the settings adjustable in the local menu you can also change...

Page 114: ...do NOT change the duration of the test Technical Details In order to determine the attack and the release times of the hearing aid the 7000 analyzer calculates the settling amplitude of each measurement and uses the tolerance setting to achieve the final test result The settling amplitude is calculated by averaging the last 16 measurements of the test The attack or release time is the first time t...

Page 115: ...pare the manufacturer s specifi cations with your own ANSI measurements of an aid If they do not conform within expected tolerances you can contact the manufacturer There are three different versions of the ANSI S3 22 standard ANSI 03 ANSI 96 and ANSI 87 This is because the standard periodically gets upgraded by the ANSI standards committee After the ANSI S3 22 standard has been updated the FDA re...

Page 116: ...alyzer will pause to let you turn on the compression con trols to maximum The EIN measurement uses a 50 dB SPL input instead of a 60 dB SPL input This should give better results of AGC aids with knee points between 50 and 60 dB SPL In ANSI 96 full on gain is measured at 50 or 60 dB SPL for linear aids and 50 dB SPL for AGC aids In ANSI 03 full on gain is always measured at 50 dB SPL The ANSI 96 Si...

Page 117: ... 7 Exchange the position of the dummy microphone and the test microphone and plug the battery pill into the battery voltage supply See Figure 5 1 1B Figure 5 1 1A Setup for leveling Figure 5 1 1B Setup for aid testing equivalent substitution method 5 1 2 Setting up the hearing aid for ANSI The hearing aid controls must be set to conform with ANSI requirements for the test results to be valid 1 Set...

Page 118: ...to select the full on gain FOG amplitude used in the test sequence We recommend setting this to AUTO which will automatically use the appropriate amplitude This step does not apply for ANSI 03 5 Use F5 to select whether or not to perform a telecoil measurement 6 Press MENU to enter the local menu and make any desired selections See Section 5 1 9 Use F7 to return all ANSI settings to their power on...

Page 119: ...he body of a BTE or against the faceplate of an ITE It s also usually best to position the hearing aid verti cally to get the best telecoil response See Figure 5 1 4 e Press START to measure the telecoil response The analyzer will pause after the telecoil measurements are complete f Return the aid to the normal microphone mode set the AGC controls to max ANSI 03 and AGC aids only reposition the he...

Page 120: ... Press START to resume testing 3 Depending on the aid type selected and the gain of the hearing aid the ANSI sequence may stop for you to adjust the gain control to the reference test If the sequence stops a Open the lid of the sound chamber b While viewing the HF AVG readings in the lower center of the screen turn the gain control on the aid down until the MEASURED value match es the TARGET value...

Page 121: ...evel on the way up F2 is where the RESP 50 curve crosses the response limit level on the way down 12 HFA SPA Three frequency average chosen in the MENU 13 TDH total harmonic distortion measurements and the frequencies and amplitudes at which they are taken 14 HFA SPA SPLITS Three frequency average of the telecoil frequency response curve 15 RSETS The difference between the HFA SPA of the microphon...

Page 122: ...In fact most of the testing methods employed by ANSI have been around since the 1970s However since ANSI is a standard in order to conform to that standard it must use only the testing techniques outlined in the standard For this reason the 7000 test system has no provisions for incor porating composite or digital speech into the ANSI test sequences In order to test digital hearing aids with noise...

Page 123: ...Size of the battery for the hearing aid being tested 12 dB Dist The status of the 12 dB harmonic distortion rule When mea suring harmonic distortion if the amplitude of the response at the sec ond harmonic of the frequency being measured is 12 dB greater than the amplitude of that primary frequency the harmonic distortion measure ment should be ignored at the primary frequency Turn this rule ON or...

Page 124: ...The purpose of the following settings is identical for each I O frequency AGC frequency Status of the I O test at the selected frequency Turn the test ON or OFF I O Start The delay after the first tone is presented in the I O sweep and before the first measurement is taken I O Meas The delay between frequencies in the I O sweep Attack Window The amount of time the analyzer measures the attack time...

Page 125: ...ar to the one we use in the 7000 test system There are some differences mostly in the low frequencies and in the way that the signal spectral shape is specified The committee wanted a system that could be built easily by anyone and assumed that a manufacturer who would develop equipment to make tests for this stan dard would use a white noise signal to produce the roll off above the 900 Hz knee po...

Page 126: ...ech weighted noise input SPL signal 3 Full On Noise Gain Maximum RMS gain with a 60dB SPL noise input sig nal Note This test may not elicit a true reading of maximum gain for hear ing aids with an onset of non linear operation below 60dB 4 Target Reference Gain This information is only displayed when the actual gain is greater than the calculated desired setting of gain This target is used to adju...

Page 127: ...1 Run the ANSI 92 test sequence 2 Press F6 3 Use to select Store Crvs Coup if necessary 4 Press to store the curves and close the menu The following is a list of where the curves are stored in the Coupler screen Any previous measure ments stored in those curve locations will be overwritten 50 dB SPL CRV3 60 dB SPL CRV4 70 dB SPL CRV5 80 dB SPL CRV6 90 dB SPL CRV7 5 Press EXIT and F1 to enter the C...

Page 128: ...reference test gain calculated by the 7000 ana lyzer or you can set it to the reference test gain specified by the manufacturer in IEC 118 7 We calculate the reference test gain by the following method The reference frequency is measured at 90 dB SPL value A and 60 dB SPL value B If B A 68 the calculated reference test gain is A 75 Otherwise the calculated reference test gain is B 7 5 3 1 Setting ...

Page 129: ...e 2 Turn the gain of the aid down to the reference test position Match the target value within 1 dB 3 Press START to complete the test sequence 4 Press PRINT to print test results 5 3 3 Viewing IEC Results 1 OSPL 90 response curve 2 RESP curve measured at reference test gain at 50 or 60 dB SPL 3 Full on gain curve 4 Output of 90 dB at reference test frequency 5 Maximum output and its frequency 6 R...

Page 130: ... be overwritten Full on Gain CRV 5 Response CRV 6 OSPL90 CRV 7 5 Press EXIT and F1 to enter the Coupler screen and view the IEC response curves 5 3 5 Understanding the Menu Settings The following menu settings are available in the local menu of the IEC screen Measurement Settings Noise Red Tone The amount of noise reduction used in the IEC mea surements See Section 2 3 1 2 for more details Battery...

Page 131: ...t screen 5 4 1 Running JIS Follow these instructions to run a JIS automated test sequence 1 Press F7 from the Opening screen to enter the JIS test screen 2 Use F1 to select the ear 3 Use F2 to select the aid type Press F2 use to make your selection and to complete the selection and close the pop up menu 4 Use F3 to select the amplitude of the full on gain measurement 5 Use F4 to select the test fr...

Page 132: ...ce frequency 6 Maximum output and the frequency at which it was measured 7 Gain of the FOG curve at the reference frequency 8 Reference test gain calculated target 9 Reference test gain measured actual 10 Equivalent input noise 11 Response limit and the two frequencies F1 and F2 at which the response curve crosses its horizontal line 12 Total harmonic distortion at 500 800 and 1600 Hz 13 Battery c...

Page 133: ...Settings Noise Red Tone The amount of noise reduction used in the JIS mea surements See Section 2 3 1 2 for more details Battery Meas The status of the battery current measurement Turns it ON or OFF Battery pill required for this measurement Battery Size The size of the battery of the hearing aid being tested Aid Settings Sweep Start Delay The delay after the first tone is presented in a pure tone...

Page 134: ...zer JIS Settings Equiv Noise Test Status of the EIN measurement Turns it ON or OFF Misc Settings Print Label Status of the printing label Choose ON or OFF Printer Printer used for printouts Choose INTERNAL or EXTERNAL See Section 2 4 ...

Page 135: ...ms Create targets Perform insertion gain measurements Perform SPL measurements Perform Visible Speech measurements Perform RECD measurements 6 1 1 Understanding the Real Ear Screens There are several different screens associated with real ear measurements You access each of these screens from the Real Ear Navigation screen shown in Figure 6 1 1 Figure 6 1 1 Real Ear Navigation Screen ...

Page 136: ...ront panel of the 7000 analyzer or the remote mod ule This will return you to the Real Ear Navigation screen 6 2 Real Ear Setup This section describes how to set up your client and your analyzer for real ear measurements It is important to follow these instructions carefully since your setup will have a direct impact on the accuracy of your measurements 6 2 1 Placing the Sound Field Speaker For th...

Page 137: ...ace the wedge style earhook on the client s ear 2 Attach the reference microphone facing forward on the wedge of the earhook directly above the ear to be tested The reference microphone should be as close to the head as possible See Figure 6 2 2 3 Adjust the round Velcro pad on the wedge style earhook by turning it so that the inside pad fits firmly against the client s neck Figure 6 2 2 Placing t...

Page 138: ... Mark the probe tube where it meets the outside surface of the earmold with a marking pen See Figure 6 2 3A 4 Attach the probe tube to the body of the probe microphone 5 Attach the probe microphone to the round Velcro pad on the earhook 6 Insert the probe tube without the earmold or aid into the client s ear so that the mark is at the location where the bottom of the outer surface of the earmold w...

Page 139: ... dB SPL in 5 dB increments see procedure below In special cases when you select 130 or 140 dB SPL be aware that extra care is necessary with any output that may exceed 132 dB SPL Keep in mind that the sound pressure level at the eardrum can be higher than that measured at the mid ear canal position especially at high frequencies For this reason EXTREME CAUTION is advised when performing real ear S...

Page 140: ...E PROBE TUBES Use a new probe tube for each ear to prevent the possible spread of infection Sterilization of probe tubes is not pos sible and germicidal solutions can leave a residue inside the tubing which can result in errors Do not cut off any portion of the tube ...

Page 141: ...e so that it runs through the tragal notch resting against the lower edge of the tragus If neces sary reposition the body of the probe microphone lower on the Velcro button of the ear hanger If desired use surgical tape to hold the tube in position Figure 6 2 3B Unaided response with correct insertion of the probe tube 6 2 4 Leveling the Sound Field Speaker The first step in making real ear measur...

Page 142: ...he Real Ear Navigation screen 3 Press F3 or F4 from the Real Ear Navigation screen to enter either the Insertion Gain screen or the SPL screen respectively 4 Press LEVEL 5 The instrument will attempt to level the sound field speaker There are three leveling statuses a LEVELED This indicates the leveling process was correct within 1 dB b LEVEL FAILED This indicates that the leveling process is inco...

Page 143: ...n 2 8 for details on the leveling status and troubleshooting the level ing process 6 2 5 Setting up Body Aids The setup below is recommended for Body aids REFERENCE MIC PROBE MIC TOP VIEW 12 SPEAKER REFERENCE MIC SIDE VIEW PROBE MIC ON EARHOOK BODY AID FACING FORWARD SPEAKER HEAD HIGH 12 Figure 6 2 5 Setting up a body aid for real ear testing 6 3 Real Ear Targets This section describes how to ente...

Page 144: ...ess to complete the selection and close the pop up window 7 Press F2 to select UCL if you would like to input your client s measured uncomfortable levels Press F3 if you would like to predict the UCL values Pascoe 1988 is used for calculating UCL values 8 Press F4 and select COPY EAR with if you would like to copy the data from the selected ear into the other ear Press to make the selection This i...

Page 145: ...wing menu settings are also avail able Compression The compression kneepoint of the hearing aid If the hear ing aid has multiple compression kneepoints use the first one No of Channels The number of channels of the hearing aid Aid Limit Type of output limited employed by the aid Choose from Multichannel or Wideband Fit Type Type of hearing aid fitting used by the patient Choose Unilateral or Bilat...

Page 146: ...ducer It s also possible to use a linear hearing aid instead of an insert earphone to perform the RECD test In this case you would use the same hearing aid set with identical volume control and or other settings for both the coupler and real ear portions of the test The DSL Method does NOT recommend using a hearing aid as the RECD transducer Coupler Measurement The coupler part of the RECD is perf...

Page 147: ...reen to open the Setup menu 7 Press F4 to perform the coupler measurement This also saves the coupler measurement in permanent memory 8 Press EXIT to return to the Opening screen Figure 6 3 5A Figure 6 3 5B Insert earphone attached to coupler Probe tube in probe mic adapter To perform the real ear measurement 1 Insert the 50 ohm insert earphone into the jack on the back of the 7000 test system lab...

Page 148: ... Foam plug or custom earmold Figure 6 3 5C Insert probe microphone Figure 6 3 5D Insert foam eartip connected to insert microphone 9 Press EXIT to close the menu 10 Use F2 in the Audiogram Entry screen to select RECD You may have to push the button several times 11 Press START to take the measurement The results will appear in both graphical and numeric format See Figure 6 3 5 E If you have previo...

Page 149: ... to dial difference REDD 1 Enter the Real Ear Navigation screen by pressing F2 from the Opening screen or EXIT from a real ear screen such as the Audiogram Entry screen 2 Press F2 to enter the Real Ear Target screen See Figure 6 3 6 If you have input an audiogram as described in Section 6 3 1 you should see targets in both the SPL and gain graphs 3 Select the desired ear with F1 4 Use F3 to select...

Page 150: ...e your selection without closing the pop up window Select the Source Level Choose between 40 through 90 dB SPL Press to make your selection and close the pop up window 7 Use the arrow keys to make your modifications to the target The keys select the desired frequency and the keys modify the amplitude 1 dB at a time Note When you edit the Target IG the Target SPL will also be updated However when y...

Page 151: ...sertion Gain and Real ear SPL screens are explained in this section See Section 6 7 for operation of the Visible Speech screen 6 4 1 Measuring in the Insertion Gain screen Insertion Gain is the most conventional method used for performing real ear measurements In the typical insertion gain procedure 1 The probe tube is inserted into the ear canal Section 6 2 3 2 The sound field speaker is leveled ...

Page 152: ...elected Target Curve A uses the source settings of REAG 3 This only applies when the NAL NL1 fit ting rule is selected All other fitting rules on the 7000 are linear which means the target does not change with respect to the source type and amplitude of the signal Most of the operations of the Insertion Gain screen are identical to the opera tions of the Real ear SPL screen Therefore most of the i...

Page 153: ...urves the target will automati cally adjust These curves are color coded to make it easier to match the mea surement curve to the appropriate target Target L and REAR 2 are blue Target M and REAR 3 are green and Target H and REAR 4 are red The long term average speech spectrum LTASS is also displayed as three dotted l m and h curves The LTASS is the average real ear unaided response The m curve is...

Page 154: ...f the graph 6 4 3 Measuring the Unaided Response REUG REUR The REUG REUR is a measurement of the unaided response of the patient s ear canal It can be measured in either the Real ear Insertion Gain screen or the Real ear SPL screen and any measurement performed in one of these screens will be automatically displayed in the other screen To measure the unaided response 1 Position the patient in fron...

Page 155: ...of output SPL REUR REAR The SPL display includes includes the input signal in the measurement The gain display subtracts the input signal in the measurement 1 Enter the Real ear Insertion Gain screen 2 Press MENU to open the local menu 3 Select Display using the up down arrow keys 4 Use the right arrow key to choose between Gain and SPL 5 Press EXIT to return to the Real ear Insertion Gain screen ...

Page 156: ...ch weighting and input level of the selected aided measurement This allows the clinician to measure the unaided response at one level and directly compare it to aided measurement curves measured at another level To enable the REUR Auto Adjust press MENU in the Real ear Insertion Gain or Real ear SPL screen to open the local menu Use the arrow keys to select REUR Auto Adjust under Measurements and ...

Page 157: ...5 are set accordingly Use the up down arrow keys to change the selected source amplitude at any time Target Curve A is always adjusted to the source type and amplitude of the current selected aided curve Measuring in the Real ear SPL screen For a description of the Real ear SPL screen see Section 6 4 2 In Figure 6 4 2 Curve 2 is displayed as a solid blue curve on the SPL graph When the NAL NL1 tar...

Page 158: ...e top graph If the NAL NL1 fitting rule is selected this target adjusts according to the input level setting of the current selected curve That is if the amplitude of the source is set to 50 dB SPL the displayed target is for a 50 dB SPL input level If the clinician changes the input level to 80 dB SPL the target will decease showing the prescription for that input level When the unaided REUG 1 is...

Page 159: ...e real ear measurement screen The analyzer will now be in Semi Automatic mode Fully automatic mode automatically measures REAR 2 REAR 3 REAR 4 and REAR 5 in quick succession When REUR 1 is selected after pressing START to perform the unaided measurement the user must still press STOP to stop the test This will automatically advance the curve selection to REAR 2 but no measurement will be taken unt...

Page 160: ... microphone positioned outside the ear This occurs when the reference microphone is ON If you are in a particularly noisy environment or if you are testing an open fit hearing aid the reference microphone measurement could introduce unwanted artifacts into your testing When the reference microphone is disabled the analyzer uses the information determined during the leveling process to determine th...

Page 161: ...aphical non numeric format 5 Press EXIT to return to the Insertion Gain screen Instead of the measure ment graphs you will now see tables of numerical data See Figure 6 4 9 6 Use F2 to select the curve you want to view Depending upon your selec tion in Step 3 you will either see the insertion gain or the aided gain results Figure 6 4 9 Insertion Gain data format display To view curve data in the R...

Page 162: ...2 to select the curve you want to delete 2 Use F4 to delete the selected curve The following selections are available DELETE SELECTED CURVE Deletes the curve but retains the curve set tings such as the source type and source level DELETE SELECTED CURVE AND SETTINGS Deletes the curve and return the source type and level to their default settings DELETE ALL CURVES Deletes all curves but retains the ...

Page 163: ...thed by averaging it together with the out puts from the next upper and lower 12th octave frequency To turn on off log smoothing 1 Enter the measurement screen 1 Press MENU to enter the local menu 2 Use to select Smoothing under Display 3 Use to choose LOG or OFF 4 Press EXIT to return to the measurement screen All measurements will have the chosen smoothing status Figure 6 4 11 A comparison of a ...

Page 164: ...asurement menu 2 Press to select Output Limit under Measurements 3 Use to choose the desired limit 4 Press EXIT to return to the real ear measurement screen 6 4 13 Measuring the occlusion effect You can use the Insertion Gain screen in order to measure the occlusion effect of a hearing aid By analyzing the spectrum of your client s own voice you can judge whether the occlusion effect will make the...

Page 165: ...models require a little more thought and care these aids have a noise suppression feature also known as speech enhancement This noise suppression not to be confused with the automatic compression of AGC hearing aids checks if the sound going into the hearing aid is a continuous signal that could be regarded as noise If the aid decides that the sound is noise it lowers the gain at the corresponding...

Page 166: ...een 2 Use to select Composite Filter under Source 3 Use to choose ANSI or ICRA 4 Press EXIT to return to the real ear measurement screen Any Digital Speech or Composite signal will use the new selected speech weighting Figure 6 5 2 A comparison of an aid being tested with Digital Speech using the ICRA CRV 3 and the ANSI S3 42 CRV 2 speech weightings 6 5 3 Testing the digital filters It is possible...

Page 167: ...g Go back into the menu to turn the bias signal OFF again Figure 6 5 3 Using the bias signal in real ear measurements CRV 2 5 were measured using bias signal frequencies of no bias 500 Hz 2000 Hz and 4000 Hz respectively 6 5 4 Testing digital noise suppression The comparison of the frequency response using the Composite signal and the Digital Speech signal can be used to see how much the aid lower...

Page 168: ... of a digital hearing aid REAR 2 was tested using Digital Speech REAR 3 was tested using the Composite Signal 6 6 Directional Hearing Aids The directional advantage provided by a hearing aid can be easily measured with real ear measurements This section describes a method of measuring directionality using the Real ear Insertion Gain screen 6 6 1 Using the insertion gain technique The Real ear Inse...

Page 169: ...urement curve 9 Use F2 to select REAG 2 10 Use F5 to set the source type to DIG SPEECH 11 Use to set the source amplitude to 50 dB SPL Figure 6 6 1 Testing directionality REUR 1 was tested with the source at 135 azimuth REAR 2 was tested with the source at 45 azimuth Curve 6 illustrates the directional advantage of the hearing aid 12 Reposition the patient so that the sound field speaker is placed...

Page 170: ...r stand Try to keep the speaker equal distance from the patient while moving the speaker in a semi circle behind him Look at the frequency response as the speaker is moved If the aid is direc tional its frequency response will decrease as the speaker is moved from the front of the patient to the back of the patient The angle at which the frequency response is at its lowest is the null of the direc...

Page 171: ...tudes of each frequency These measurements can be compared to the patient s thresholds uncomfortable lev els real ear target s and the long term average speech spectrum When first entering the Visible Speech screen Figure 6 8 it has the following characteristics 1 Shaded areas below and above the patient s patient s threshold and uncom fortable values respectively The non shaded area in the center...

Page 172: ... 3 Press F5 to enter the Visible Speech screen 4 Insert the probe microphone into the patient s ear as described in Section 6 2 3 The reference microphone is not used in this measurement It can be placed on the earhook as normal or left hanging behind the patient s back 5 Insert the hearing aid into the ear being careful not to move the probe tube 6 Situate the patient in front of the person who w...

Page 173: ...e hearing aid over the time of the test The region around the average frequency response curve is darkly shad ed This region represents the standard deviation of the average response curve That is the area containing most of the frequency response curves measured during the test The real time measurement curve disappears Since this curve represents the latest measurement of an ever changing speech...

Page 174: ...ech Envelope 1 Then use F2 to select Visible Speech Envelope 2 Press F2 Use to select the desired envelope Press to complete the selection and close the pop up menu Repeat the test with the spouse standing across the room from the patient A comparison of the two envelopes can demonstrate to the patient and the spouse how close they need to be to each other in order for speech to be easily audible ...

Page 175: ...h of these measurements uses the insertion gain measurement technique taking advantage of the fact that the insertion gain is a difference curve between two measured curves usually the unaided and aided response The techniques assign the label of unaided to one measurement and a label of aided to another measurement Take all measurements in the Insertion Gain Screen For measurements labeled Unaide...

Page 176: ...onse on good ear side Same setup as above except Probe microphone over the good ear The difference curve labeled Insertion Gain on the screen shows the attenua tion of sound arriving at the good ear from the bad ear side Since this measurement excludes the external ear differences across individuals should be minimal NOTE Although the above two measure ments calls for the 7000 test system to be UN...

Page 177: ... Reference microphone ON Sound field LEVELED Unaided CUSTOM Reference microphone over pinna of bad ear Probe microphone inside unoc cluded ear canal of good ear Loudspeaker at 90º 12 inches from bad ear Aided Measurement of good ear canal baffle overcome by aid Same setup as above except Aid in place in good ear and set to normal user gain The difference curve labeled Insertion Gain on the screen ...

Page 178: ... Same setup as above except Transmitter on bad side turned on The difference curve labeled Insertion Gain on screen shows the benefit of adding the second microphone for sound arriving from the bad side 6 9 3 Measuring Overall Insertion Gain The methods for measuring the overall insertion gain of CROS and BICROS aids are described in this section Since it has not been shown for CROS and BI CROS in...

Page 179: ... of inserting the hearing aid 6 9 3 2 BI CROS Unaided Measurement of better ear Set up the 7000 test system as follows Reference microphone ON Sound field LEVELED Unaided response CUSTOM Reference microphone over pinna of bad ear Probe microphone inside unoccluded ear canal of better ear Loudspeaker at 0º 12 inches from bridge of nose Aided Measurement of better ear Same setup as above except Comp...

Page 180: ... monaural measurement a 45º position of the loudspeaker is rec ommended Unaided Unoccluded Ear canal Response of good ear Set up the 7000 test system as follows Reference microphone ON Sound field LEVELED Unaided CUSTOM Reference microphone over pinna of good ear Probe microphone inside unoccluded ear canal of good ear Loudspeaker at 45º toward good ear 12 inches from surface of head Aided Occlude...

Page 181: ...ency Range 200 through 8000 Hz Amplitude Range From 0 through 150 dB 90 through 110 dB gain Resolution 0 1 dB Type True RMS Accuracy M1950E Within 1 dB plus or minus 1 digit from 300 to 5000 Hz within 2 dB plus or minus 1 digit for all other frequencies SPL Equivalent Input Noise Less than 50 dB RMS M1950E Noise Reduction Averages the measured signal in synchronism with the signal generator by the...

Page 182: ...er Resolution 2000 8000 Hz 1 25 mSec 800 1600 Hz 2 5 mSec 400 500 Hz 5 mSec 100 to 300 Hz and Composite 10 mSec Available Test Modes ANSI 96 ANSI 87 Signal Durations ANSI 87 2000 mSec ANSI 96 variable 500 to 5000 mSec TEST SEQUENCES Choose ANSI or IEC as part of standard package Additional charge for the second test sequence ANSI 3 22 87 92 96 IEC EN60118 7 1993 FEATURES Group Delay and Phase Meas...

Page 183: ...on Ambient Noise Isolation 45 dB at 1 kHz allows THD measurement to within 3 at 60 dB source level and a 60 dB ambient Color Gray with black trim Black and white test area Size 13 5 W x 18 H x 11 5 D 34 3 x 45 7 x 29 2cm Weight 36 lbs 16 3 kg SHIPPING INTERNATIONAL Total Shipping Weight with Quik Probe Option 97 lbs 45 kg Total Shipping Weight without Quik Probe Option 77 lbs 35 kg STANDARD ACCESS...

Page 184: ...d which brings the testing area or the test chamber to convenient table height Blue color Quest QC 10 Sound 030 0004 00 For calibration of microphone Level Calibrator amplifier 1 kHz 114 dB SPL Telewand 043 1053 00 For checking response of aids in telephone mode ANSI S3 22 1996 Telecoil Induction Loop 120 1002 00 For checking hearing aid response to a magnetic loop field Battery Pills AA 059 1011 ...

Page 185: ...er Figure B 1A Equipment for calibrating the 7000 microphones To calibrate the M1950E coupler microphone 1 Press MENU from the Opening screen to open the Setup Menu 2 Press F6 to open the Microphone Calibration window 3 Insert the 14mm to 1 inch adapter into the sound level calibrator 4 Insert the M1950E coupler microphone into the adapter 5 Turn on the sound level calibrator and look at the Coupl...

Page 186: ...teps 1 3 above to set up the 7000 Test System for calibration 2 Insert the reference microphone into the adapter 3 Turn on the sound level calibrator and look at the Ref Mic level in the Microphone Calibration window It should match the calibrated tone emit ted by the sound field calibrator This is usually 110 dB SPL or 114 dB SPL Check your calibrator for details 4 If necessary adjust the gain of...

Page 187: ...Thread the probe tube through the edged side of the probe microphone adapter so that the probe tube sticks out a couple of millimeters from the other end of the adapter See Figure B 1D Figure B 1D Calibrating the real ear probe microphone 8 Secure the probe tube in place by putting a dab of Fun Tak on the edged end of the adapter 9 Insert the probe microphone adapter with the attached probe microp...

Page 188: ...done only when the probe and reference microphones are calibrated The RECD measurement is usually done with a 50 ohm insert earphone Eventually the 7000 Test System will also support an RECD method performed with a linear hearing aid but that has not yet been implemented 1 Insert the earphone connector into the inch Earphone jack on the back of the 7000 Test System 2 Plug the other end of the earp...

Page 189: ...Calibration 181 Figre B 2 Calibrating the insert earphone ...

Page 190: ...182 FONIX 7000 Hearing Aid Analyzer ...

Page 191: ...ness and contrast controls d Check the cable between the monitor and instrument e Make sure nothing is resting against the probe keyboard or main panel and causing a stuck button Test Chamber Problems Test Chamber Microphone does not Level a Check your mic calibration See Appendix B b Is the mic properly plugged into the instrument c Are all connections clean and tight d Is the mic head element sc...

Page 192: ...ed into the instrument c Are all connections clean and tight d Are the mic cables loose broken cut worn or frayed e Is the Leveling signal coming out of the speaker If not check cable and connections f Make sure the distance from the speaker to the ref mic during leveling is about 12 max 18 2 Cleaning probe tubes DO NOT REUSE probe tubes There is NO recommended cleaning proce dure Germicidal solut...

Page 193: ...ram was used with the coupler to apply correction factors to the measured curves from the hearing aid so that the output was very similar to that which would be obtained if the aid were tested on a standardized ear simulator as built by Knowles or B K These software corrections work well for most regions in the frequency response of the aid In low frequency areas up to about 1500 Hz if the aid has...

Page 194: ...ge with frequency then the large changes in impedance of the TM are swamped by the large volume of the ear canal If on the other hand the TM is working into a very small volume then it would affect a large change in impedance across the frequency range CIC Hearing Aid Gain and Frequency Response Changes From the above discussion we see that we can expect that the frequency response of the CIC hear...

Page 195: ... 5 dB at 8000 Hz for a total variation of 14 1dB Summary Using the CIC coupler with its software option gives the dispenser an immediate idea of how much gain that this new type of hearing instrument is going to give the hearing impaired individual It is nice to see that the CIC hearing aid can really produce significant amounts of gain in spite of its apparently poor perfor mance in the 2cc world...

Page 196: ... 8 800 0 7 2800 3 85 4800 4 8 6800 8 2 900 1 2900 3 95 4900 4 85 6900 6 55 1000 1 2 3000 4 5000 4 9 7000 6 1100 1 4 3100 4 07 5100 4 95 7100 5 4 1200 1 65 3200 4 12 5200 5 7200 4 95 1300 1 9 3300 4 18 5300 5 05 7300 4 2 1400 2 1 3400 4 2 5400 5 1 7400 3 6 1500 2 2 3500 4 25 5500 5 15 7500 3 3 1600 2 4 3600 4 3 5600 5 2 7600 2 8 1700 2 5 3700 4 35 5700 5 25 7700 2 3 1800 2 7 3800 4 4 5800 5 3 7800 ...

Page 197: ... 2dB S 6000 X 31 HTL 2dB S 8000 X 31 HTL 2dB S Where you calculate X and S Slope correction values as follows a T HTL 500Hz HTL 1000Hz HTL 2000Hz b If T is less than or equal to 180dB then X 05 x T If T is greater than 180dB then X 05 x 180dB 116 x T 180dB c If the HTL at 2000 Hz is less than 95dB S 0 If the HTL at 2000 Hz is greater than or equal to 95dB then apply the following slope correction ...

Page 198: ...00 1 2 HTL 8000 1 2 HTL Note Frequencies preceded by an asterisk are interpolated because the article does not reference them BERGER A Method of Hearing Aid Prescription by Kenneth W Berger PhD Eric N Hagberg M A Robert L Rane PhD Hearing Instruments July 1978 Required insertion gain is calculated as follows Frequency Hz Insertion Gain dB 250 1 2 HTL 500 1 2 HTL 750 1 2 HTL 1000 1 1 6 HTL 1500 1 1...

Page 199: ...le 1 2 rule 250 2 3 HTL 5 dB 1 3 HTL 5 dB 1 2 HTL 5 dB 500 2 3 HTL 3 dB 1 3 HTL 3 dB 1 2 HTL 3 dB 750 2 3 HTL 1 3 HTL 1 2 HTL 1000 2 3 HTL 1 3 HTL 1 2 HTL 1500 2 3 HTL 1 3 HTL 1 2 HTL 2000 2 3 HTL 1 3 HTL 1 2 HTL 3000 2 3 HTL 1 3 HTL 1 2 HTL 4000 2 3 HTL 1 3 HTL 1 2 HTL 6000 2 3 HTL 5 dB 1 3 HTL 5 dB 1 2 HTL 5 dB 8000 2 3 HTL 5 dB 1 3 HTL 5 dB 1 2 HTL 5 dB Note Frequencies marked by an asterisk ar...

Page 200: ...192 FONIX 7000 Hearing Aid Analyzer ...

Page 201: ... 4 If Aided 2 is composite subtract 10 7 dB from each frequency If Aided 2 is Speech Weighted tone add 2 1 dB to each frequency 5 If Aided 2 is Speech Weighted subtract the Speech Weighting in Table 2 The complete formula is then Target SPL Target IG CRV2 source AVG REUR If Aided2 is composite 10 7 dB Speech Weighting If Aided2 is speech tone Speech Weighting To convert the HTL and UCL from HL to ...

Page 202: ...00 8 3 7700 4 8 1800 9 3 3800 13 9 5800 8 2 7800 4 6 1900 10 9 3900 13 5 5900 8 0 7900 4 4 2000 12 6 4000 13 1 6000 7 8 8000 4 2 TABLE 2 Speech Weighting FREQ FREQ FREQ FREQ Hz dB Hz dB Hz dB Hz dB 2100 8 1 4100 13 4 6100 16 7 200 0 2 2200 8 4 4200 13 6 6200 16 9 300 0 5 2300 8 8 4300 13 8 6300 17 0 400 0 8 2400 9 1 4400 14 0 6400 17 1 500 1 2 2500 9 4 4500 14 1 6500 17 3 600 1 6 2600 9 7 4600 14 ...

Page 203: ...750 10 5 1000 9 0 1500 9 5 2000 15 0 3000 15 5 4000 13 0 6000 13 0 8000 14 0 TABLE 4 HTL HL to UCL HL prediction table from Pascoe 1988 Table 4 HTL UCL HTL UCL dBHL HL dBHL HL 0 97 65 114 5 99 70 115 10 99 75 117 15 98 80 120 20 97 85 120 25 101 90 124 30 102 95 130 35 101 100 127 40 103 105 133 45 105 110 134 50 107 115 137 55 108 120 140 60 110 ...

Page 204: ...196 FONIX 7000 Hearing Aid Analyzer ...

Page 205: ...ment A section number and date year following the initials ANSI designate the standard referred to ARTIFACT A false reading ASP Automatic Signal Processing A feature on a hearing aid intended to overcome the effects of background noise making it easier to understand speech when noise is present The term ASP is not standardized and may refer to various forms of signal processing Usually however ASP...

Page 206: ...significant energy to the External Ear Effect in the region of 5000 Hz COIL Abbreviation for telephone pickup coil COMPOSITE The FONIX test signal consisting of 79 pure tones presented simultaneously CONVERSION A hearing aid prescription formula used to convert an audiogram to a FORMULA target curve Common formulas are the NAL Berger POGO and the 1 2 1 3 or 2 3 Gain rules CORFIG Coupler Response f...

Page 207: ...It usually is expressed in units and or percent EXTERNAL See Unaided Response EAR EFFECT FAST FOURIER A computer short cut of the FOURIER TRANSFORM method for ANALYSIS determining the frequency content of a signal FLAT Same as UNWEIGHTED referring to a signal that has equal amplitude at WEIGHTED every frequency FOURIER A mathematical procedure that changes time information into TRANSFORM frequency...

Page 208: ...uency sound by the head and pinna blending to produce a baffle HL Hearing Level The amount of decibels above audiometric zero at which a measured ear barely hears a sound Hz Hertz Unit of frequency referring to cycles per second ICRA International Collegium of Rehabilitative Audiology IEC International Electrotechnical Commission An international organization that sets standards for measurements I...

Page 209: ...t has a switch to select either a CROS a BI CROS or a Monaural arrangement MZ COUPLERS Modified Zwislocki Couplers Three couplers based on the Zwislocki design but sturdier provided with the OES option NAL National Acoustic Laboratories of Australia NBS National Bureau of Standards U S now known as National Institute of Standards and Technology NOISE The 7000 s method of producing a more stable re...

Page 210: ... a reference measurement that is compared to that of the probe microphone placed in the ear canal REFERENCE The location in a test chamber where the microphone of a hearing aid POINT must be placed for accurate testing In the 7000 it is the small circle in the center of the test chamber REAR Real Ear Aided Response See Aided Response REDD Real Ear to Dial Difference This is the difference of the o...

Page 211: ...ls dB a logarithmic measure of the energy amplitude of a particular sound as compared to the energy of a specified reference sound SSPL OSPL Saturation Sound Pressure Level The greatest SPL that a given amplifier can produce SSPL 90 Saturated Sound Pressure Level for an input of 90 dB SPL OSPL 90 SWEEP A sequence of pure tone frequencies which generates a frequency response curve TARGET A curve ba...

Page 212: ...verage of speech WEIGHTED The measurement of amplitude in SPL of the output of an aid using POWER an input signal source that has a spectral shape similar to that of the long term average of speech WHITE NOISE A signal composed of all frequencies which vary randomly in phase each frequency having equal long term energy levels WINCHAP Windows Computer Hearing Aid Program used for storing hearing ai...

Page 213: ...Chirp 40 CIC 88 115 CIC coupler 8 9 Cleaning 19 Composite 37 69 84 amplitude 41 chirp 40 display 56 shape 84 standard 40 type 40 Composite Filter 84 95 Composite Type 95 Computer connection 52 Connections 17 COPY EAR 136 Couplers 59 6 cc 8 CIC 8 185 ear level adapter 4 HA 1 4 HA 2 59 MZ 8 9 0 open ear 9 63 Coupler I O 103 Coupler screen 55 local menu 94 Coupler type 95 Crest factor 40 CROS wireles...

Page 214: ... History 1 HTL 136 141 I I O Meas 116 I O Meas Delay 123 125 I O Start 116 I O Start Delay 123 125 I O Test 103 ICRA 84 158 IEC 120 IEC 60601 14 IEC Option 3 IG DATA 153 Infant earhook 8 Insertion gain 143 149 150 160 Intermodulation distortion 38 76 ITE 60 J JIS 123 125 L Label 43 LEDs 12 LEVEL 12 28 Leveling 57 108 removing 58 saving 58 sound field 133 sound field speaker 133 Local menu coupler sc...

Page 215: ... short 33 Pure tone signals 33 R REAG 144 148 See REAR Real Ear Navigation screen 127 Real Ear Option 2 127 Real ear SPL 145 149 150 Real ear targets 145 REAR 145 147 148 Rear panel layout 13 RECD 138 180 REDD 142 143 Reference mic 162 Reference microphone 129 152 REIG 149 Release Window 116 Remote module 6 52 RESET 12 28 Res Crv Sweep Meas Delay 116 Res Crv Sweep Start Delay 116 REUG 144 146 REUR...

Page 216: ...Sweep Start Delay 95 122 125 Swing arm 6 T Target 135 137 149 150 modifying 141 SPL 141 Targets 145 Telecoil 78 111 112 Telewand 79 111 Test Chamber Cable 5 Three frequency average 73 151 Three frequency sequence 151 Time 29 Toggle 24 Tone 151 Tone filter 32 36 Transducer 136 Troubleshooting 183 general 183 12 dB Dist 115 U UCL 136 141 Unaided response 146 User mode 30 V VA CORFIG 3 115 Visible Spe...

Reviews: