
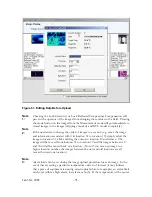
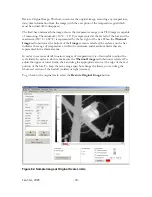
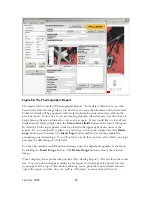

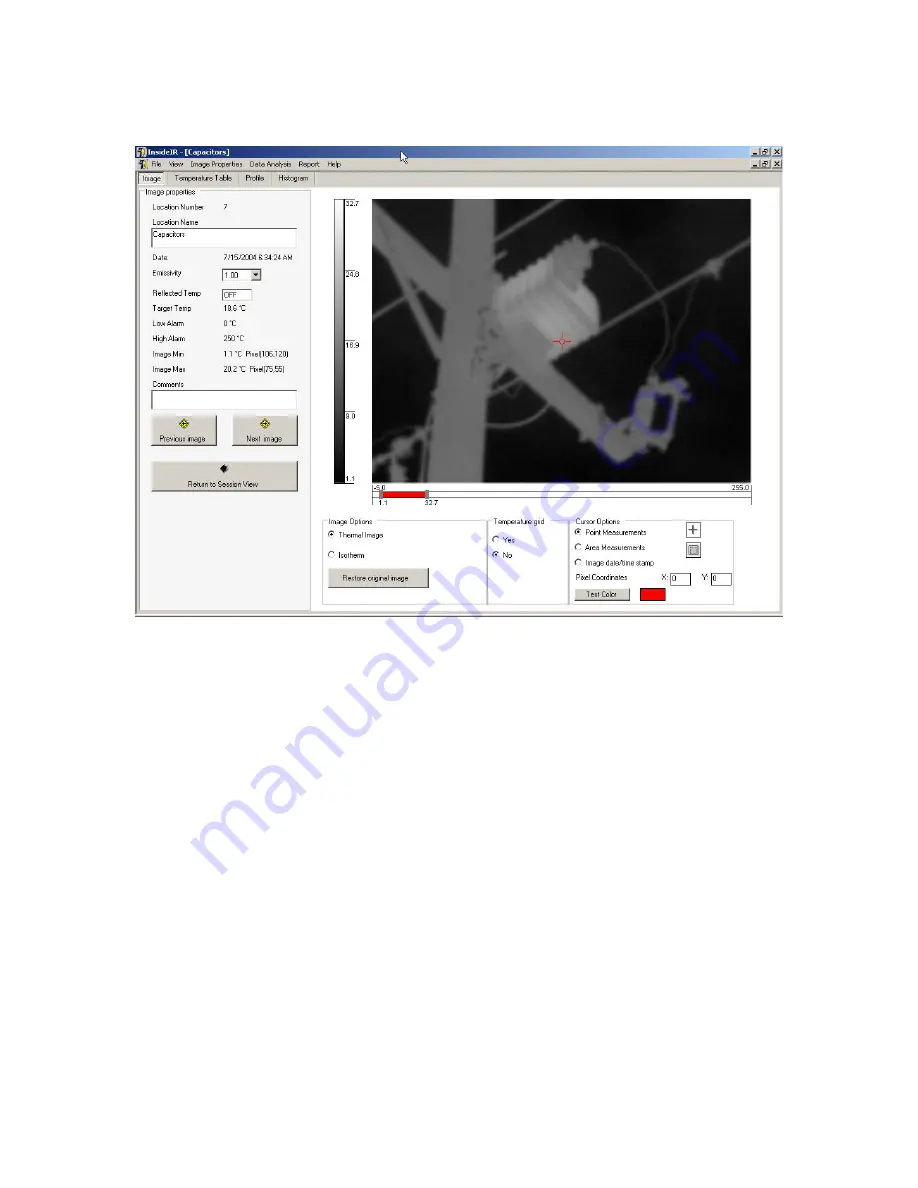
Figure 63. Sample Image After Increasing Scale Limits
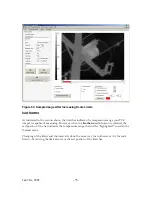
Isotherms
As indicated in the section above, the limit bar indicates the temperature range your Ti30
imager is capable of measuring. However, when the
Isotherm
radio button is selected, the
red portion of the bar indicates the temperature range that will be “highlighted” in red in the
thermal scene.
Changing of the limits and the interval is done the same way for isotherms as it is for scale
limits—by moving the limit arrows or the red portion of the limit bar.
Jan 31st, 2005
- 75 -
Summary of Contents for Ti30
Page 4: ...Appendix B Infrared Theory Q A 92 Glossary 96 Jan 31st 2005 4 ...
Page 25: ...Man Machine Interface Flow Charts Main Loop Jan 31st 2005 25 ...
Page 26: ...Image Recording Procedure Emissivity Adjustment Procedure Jan 31st 2005 26 ...
Page 70: ...Jan 31st 2005 70 ...
Page 86: ...Jan 31st 2005 86 ...


