
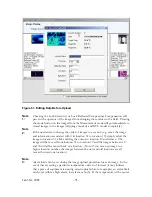
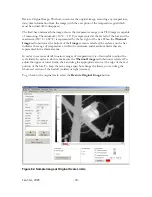
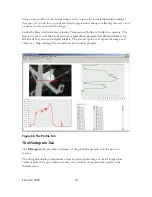

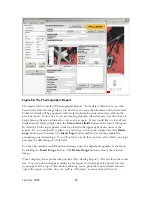


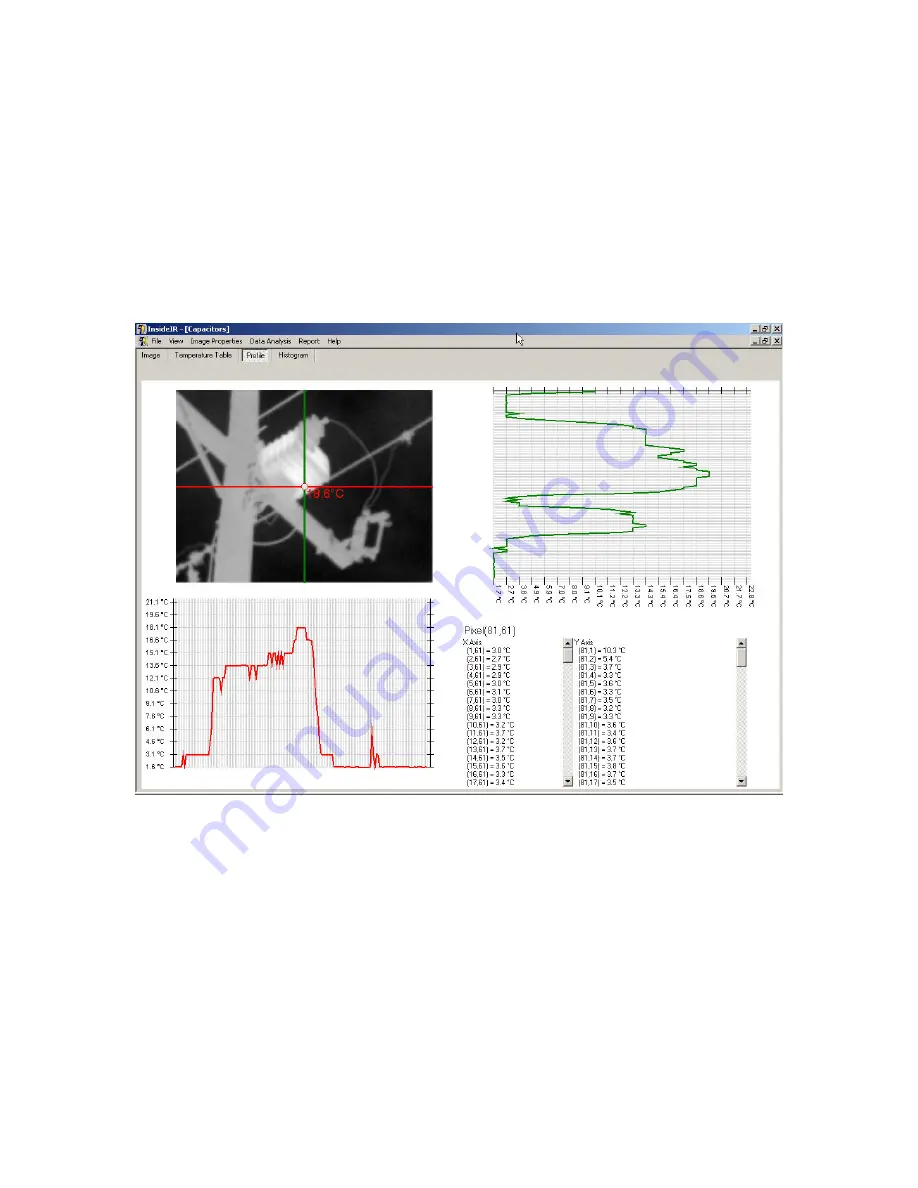
Click on any portion of the thermal image on the top for the exact temperature reading at
that spot. As you do this, you will see that the graph below changes, reflecting the new x and
y axes as you move around the image.
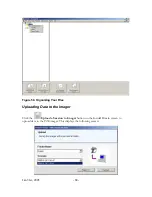
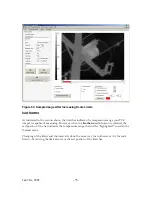
Under the Data Analysis menu, selecting Temperature Profiles will offer two options. The
first is to export a .txt file for import into a spreadsheet program (tab delimited format for
MS Excel) for your own in-depth analysis. The second option is to export the image and
charts as a .bmp (bitmap) file for insertion into another program.
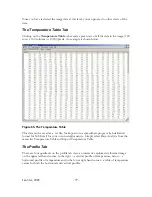
Figure 66. The Profile Tab
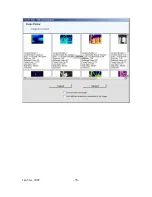
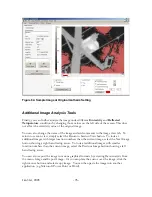
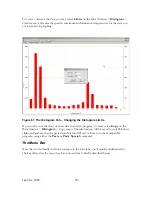
The Histogram Tab
The
Histogram
tab provides a summary of the pixel data presented on the previous
screens.
The histogram displays temperature values as either a percentage of the all temperature
values captured in a given thermal scene, or by number of representative pixels in the
thermal scene.
Jan 31st, 2005
- 78 -
Summary of Contents for Ti30
Page 4: ...Appendix B Infrared Theory Q A 92 Glossary 96 Jan 31st 2005 4 ...
Page 25: ...Man Machine Interface Flow Charts Main Loop Jan 31st 2005 25 ...
Page 26: ...Image Recording Procedure Emissivity Adjustment Procedure Jan 31st 2005 26 ...
Page 70: ...Jan 31st 2005 70 ...
Page 86: ...Jan 31st 2005 86 ...