


F
LEXCELL
®
I
NTERNATIONAL
C
ORPORATION
8
All of the remaining information and
command button states in the main display
window reflect the current state of the
system for the currently selected FX5K
™
Tension FlexLink
®
.
Figure 9.
FX-5000
™
tutorial
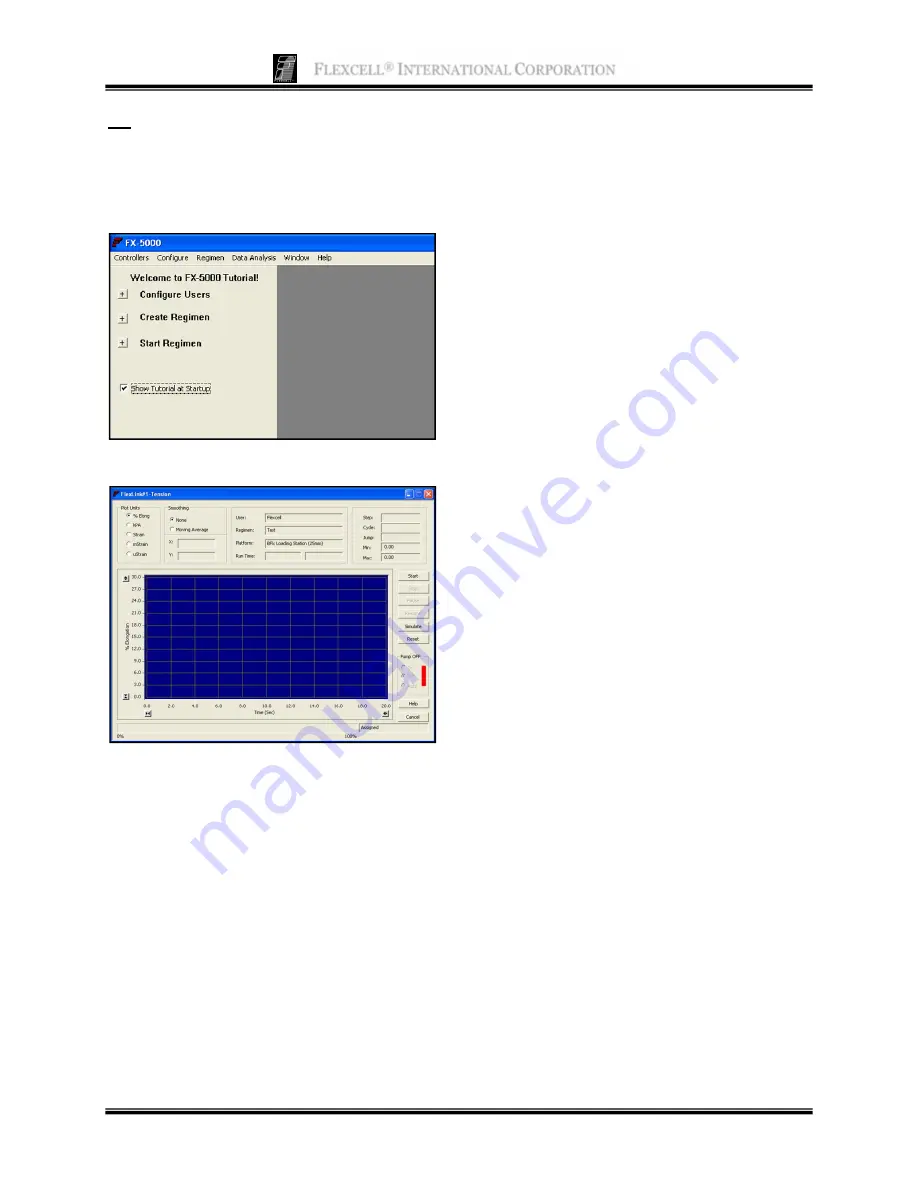
Figure 10
. Main display window
It is possible to simultaneously assign and run
a different regimen for each of the attached
FlexLinks
®
.
In the upper left hand corner of the window is
a section labeled
Plot Units
. This function
allows users to change the units of the y-axis:
% elongation, kPa, strain, millistrain
(mstrain), or microstrain (
strain). To select a
particular unit, click on the appropriate button
beside the unit label.
The next block to the right is a section labeled
Smoothing
. One expects data patterns to
represent normal distributions of a function
describing a straight line, sinusoidal curve,
etc. Therefore, the plotted points of a
mathematical function should be a
predictable data set that is “smooth” (i.e., a
curve comprised of points whose
coordinates are predicted by the function).
For a straight line, the equation would be y
= mx + b; for a power function, the equation
may be y = x
2
or some derivative thereof. In
general, data patterns may be confounded
with noise. For the case of the pressure plot
as a function of voltage from the FX-5000
™
Tension System pressure transducer, the
rough data yield a plot with a coefficient of
variation of only 0.01%. Therefore, the
signal to noise ratio for the combined
Flexcell
®
system of circuits, hardware and
transducers is high, lending confidence in
the displayed plot. Nevertheless, the user can
select a data smoothing option that is a
simple weighted average of the points. The
Smoothing section contains the option of
either applying no smoothing (
None
) to the
data points returned from the FlexLink
®
or
of applying a three-point moving average
filter (
Moving Average
) to the incoming
data. Choose the desired affect by clicking
on the appropriate button.
Below the box for Smoothing is a section
used to show the current
X
and
Y
coordinates
for the waveform. These are
displayed when the left mouse button is
clicked and held down in the graph area.
When this is done, a pair of crosshairs
appears and the coordinates at the
intersection of the crosshairs are shown in
the X and Y spaces. The crosshairs and
values will track the mouse as long as the left
mouse button is held down.
The next block to the right is a section used
to display the current
User
,
Regimen
,
Platform
, and
Run time
. Run time has two
blocks. The one on the left displays the


