Analyzing Traces
CT440
77
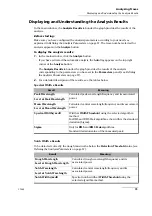
Displaying and Understanding the Analysis Results
Stop Band Test Results
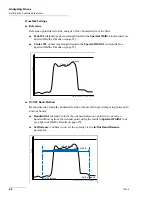
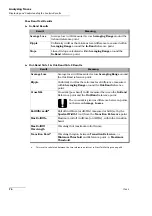
In-Band Results
Out-Band Side 1 & Out-Band Side 2 Results
Result
Meaning
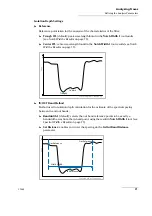
Average Loss
Average loss in dB measured across
Averaging Range
around the
in-band reference point.
Ripple
Uniformity in dB as the min/max level difference measured within
Averaging Range
around the
In-Band
reference point.
Slope
Linear fit slope calculated within
Averaging Range
around the
In-Band
reference point.
Result
Meaning
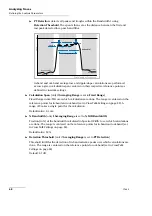
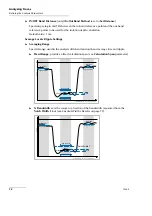
Average Loss
Average loss in dB measured across
Averaging Range
around
the Out-Band reference point.
Ripple
Uniformity in dB as the min/max level difference measured
within
Averaging Range
around the
Out-Band
reference point.
Isolation Depth
Isolation depth in dB measured between the
In-Band
Reference point and the
Out-Band
reference point.
The crosstalk is given as difference between points,
not between
Average Losses
.
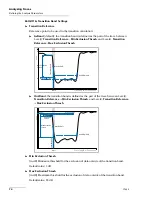
RollOff@xxdB
a
a.
: This result is calculated between the two reference points set in
Roll off in dB/nm (or dB/THz) measured at XdB (set by the
Notch Width 1
tool) from the
Transition Reference
point.
Max RollOffa
Maximum roll off in dB/nm (or dB/THz), within the transition
band.
Max RollOff
Wavelength
Wavelength of maximum roll off in nm.
Transition Band
Wavelength region between
Transition Reference
-/+
Minimum Threshold
and Reference point -/+
Maximum
Threshold
.
Summary of Contents for CT440 Series
Page 1: ...User Guide CT440 Passive Optical Component Tester www EXFO com...
Page 6: ......
Page 30: ......
Page 96: ......
Page 162: ......

