Teqwave F/I Modbus TCP
Operation
Hauser
49
11.3.2 Graph tools
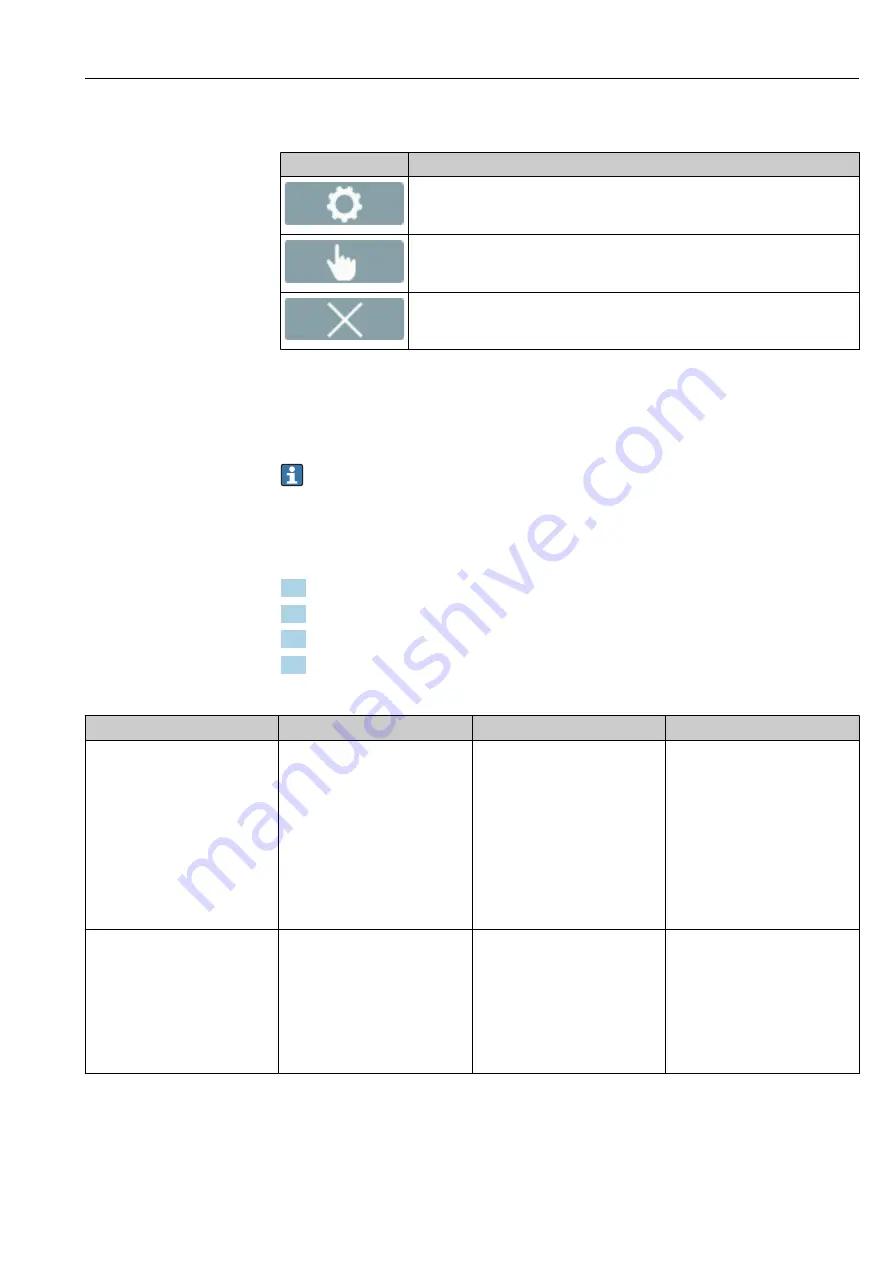
Button
Description
Settings
Navigate to the graph settings.
Cursor position
Select the cursor position in the graph for the desired measured value display.
Clear
Clears the graph. The graph representation then resumes.
11.4 Reading measured values via the operating tool
The Viewer presents the measured data in graph and text form on the home page. The
Live Viewer
mode is automatically activated once the transmitter is connected.
Following an analysis of the data offline, the "Teqwave Viewer" → "Live Viewer" menu
allows users to switch to the Live View.
11.4.1 Adjusting the graph display format
Navigation using the Viewer
1. Menu "Teqwave Viewer" → "Graph settings" → "Y-axis 1"
2. Menu "Teqwave Viewer" → "Graph settings" → "Y-axis 2"
3. Menu "Teqwave Viewer" → "Graph settings" → "Time axis"
4. Menu "Teqwave Viewer" → "Graph settings" → "Time interval in s"
Parameter overview with brief description
Parameter
Procedure
Selection/input
Factory setting
Time axis
Select the period shown on the X-
axis.
• 1 minute
• 3 minutes
• 5 minutes
• 10 minutes
• 30 minutes
• 1 hour
• 6 hours
• 12 hours
• 1 day
• 7 days
• 30 days
• 90 days
5 minutes
Y-axis 1
Select measured variables to be
displayed on the left-side axis.
Depends on the measured variables
enabled and the selected
concentration app:
• Concentration 1
• Concentration 2
• Temperature
• Speed of sound
• Density
• Dispersion
Concentration 1
Summary of Contents for Teqwave F
Page 5: ...Teqwave F I Modbus TCP Table of contents Endress Hauser 5 16 15 Documentation 75 Index 76...
Page 78: ......
Page 79: ......
Page 80: ...www addresses endress com...


