background image


User Manual


Slam Stick User Manual 

Version No. 2.0 

47 


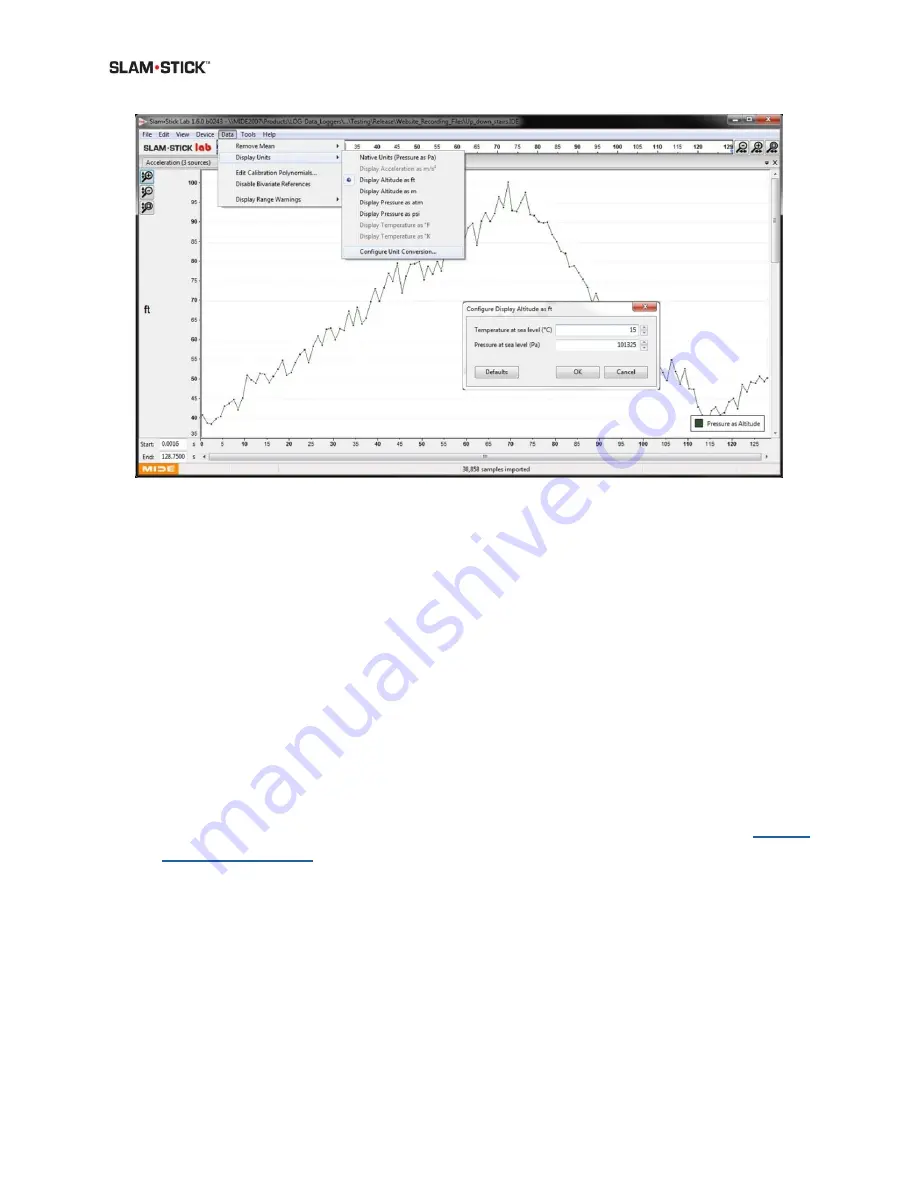
Figure 21: Under the Data drop down menu are some means of enabling data manipulation. 

Mean Removal (High-Pass Filtering) 

This is only relevant for the Slam Stick X; but users of the C and S may also use this feature in the 
Render plots option. 

The piezoelectric accelerometer in the Slam Stick X has a DC bias that shifts with temperature 
change rate; and this dependency varied dramatically from unit-to-unit.  Therefore it became 
very difficult to calibrate for and Midé instead uses a mean filtering to apply a simply high-pass 
filter to remove the DC component of the signal.  The user can either remove the mean across 
the  entire  recording;  or  remove  a  rolling  mean  (the  time  interval  is  editable  under  the 
preferences tab); or disable mean removal to see the raw signal. 

NOTE: 

Mean removal is highly recommended for viewing data from the piezoelectric 

accelerometer.  Remember that this type of accelerometer can’t measure low frequency 
or  static  accelerations;  there  will  not  be  a  1g  offset  due  to  gravity.    See  ou

blog  on 

accelerometer types

 for more information.  Only users wishing to apply their own high-

pass filter should opt to disable the mean removal. 


Unit Conversion 

A number of units are supported.  For calculating altitude from pressure data, the defaults levels 
for temperature and pressure at sea level can be edited once you’ve made the initial conversion 
into feet or meters. 

Summary of Contents for Slam Stick C

Page 1: ...User Manual Slam Stick User Manual Version No 2 0 1 User Manual Vibration Temperature Pressure Data Logger...

Page 2: ...19 Slam Stick Lab Installation 20 Slam Stick Lab Configuration 21 General Configuration 23 Setting Triggers 26 Disabling Channels 30 User Calibration Configuration 30 Device Information 33 Update Fir...

Page 3: ...e Buyer upon the return of the defective product Requests for compliance with this express limited warranty shall be honored only when made by the Buyer Refer to the Terms and Conditions at http www m...

Page 4: ...s needed This software package allows the user to configure the recorder for different sample rates or triggering modes quickly review recorded vibration temperature and pressure data and export recor...

Page 5: ...ate so that the user can perform detailed vibrational analysis A real time clock provides time stamps for all data recorded so that comparisons to real world events can be made Pressure and temperatur...

Page 6: ...e of their versatility but they have two disadvantages For one they are AC coupled which means that it can t measure static accelerations like gravity and generally can t measure slow 2 Hz vibrations...

Page 7: ...ent shock and vibration testing applications Refer to Mid s blog post on accelerometer selection for more information Table 1 provides an overview of the differences between the 3 products The catalog...

Page 8: ...el Added Sensors Temperature Pressure Temperature Pressure Temperature Pressure Temperature Pressure Advantages Excellent value Same ease of use Piezoelectric accel Frequency 1 000 Hz Aluminum more ro...

Page 9: ...ugh a variety of distributors including Amazon and Digi Key The included tape is used for calibration Calibration is not valid if other tape is used If modification to the mounting environment is poss...

Page 10: ...dings and also to manually cycle through programmed triggers The coordinate system reference illustrates the axes directions of the device The tie down slot is included to use a zip tie or a string of...

Page 11: ...is EAR99 The Harmonized tariff code or scheduled B number is 9031 80 8085 We accept all major credit cards as the preferred method of payment Purchase orders are accepted after approving credit refer...

Page 12: ...t The section entitled Mounting Instructions provides detailed mounting instructions a The most common form of mounting the device is with the Mid recommended double sided tape provided with your kit...

Page 13: ...at the yellow light is made by turning on both the green and red LED Battery cannot be charged due to extreme temperature Allow the device to reach the allowed charging temperature 0 C to 45 C If prob...

Page 14: ...trigger Allow it to wait for the trigger or hold down button to skip to next trigger or recording Rapid blinking Green to Yellow Waiting for an acceleration trigger Allow it to wait for the trigger or...

Page 15: ...age at room temperature with low humidity the Slam Stick has been tested in accordance with MIL STD 810G to ensure survival at extreme temperatures This testing included exposure to 40 C for eight hou...

Page 16: ...Figure 5 The Slam Stick is charged by using the provided USB to Micro USB cable and will connect to any standard USB power supply CAUTION Be certain to insert the USB to Micro USB Cable into the micro...

Page 17: ...harge will take one to two hours depending on the power source and the age of the battery NOTE The device may get warm during charging there is no reason for concern if you notice this The temperature...

Page 18: ...t various sampling frequencies as well as expected recording time for a 2GB memory card when a Slam Stick is plugged in to an external power source The use of a consistent power source such as a compu...

Page 19: ...econds after midnight meaning a file that started recording at 9 00am will be stored as SSX32400 because 9 00am is exactly 32 400 seconds after midnight NOTE If the folders are named with the incorrec...

Page 20: ...ck devices will not initiate a new recording if the 4GB limit is reached If a data file becomes corrupted or does not display data i e a 0 Kb file in the Slam Stick Lab the Slam Stick may have stopped...

Page 21: ...Stick to best meet your testing needs Figure 6 Video 1 of Mid s how to video series goes through an example configuration The video is available on YouTube here To open up the configuration settings...

Page 22: ...w displays available Slam Sticks for configuration 4 Select OK The configuration settings window will appear allowing the user to adjust the measurement settings on the Slam Stick Figure 8 Configurati...

Page 23: ...for the trigger condition it will remain off General Configuration The General configuration settings are the Slam Stick settings that appear when the configuration settings window is opened This is...

Page 24: ...asure the necessary vibrations shock events expected during use As a guideline it is recommended that the sampling frequency be set to no less than ten 10 times the frequency of the vibration expected...

Page 25: ...or this configuration it is recommended to use the default value on the Slam Stick by unchecking the box next to this configuration NOTE Frequencies higher than the anti aliasing cutoff frequency will...

Page 26: ...offset between the user and the UTC Setting Triggers Located to the right of the General tab in the configuration settings window is the Triggers tab Triggers are configuration settings useful when a...

Page 27: ...re multiple triggers are set Slam Stick will wait for each trigger setting to be accomplished before a recording begins But some triggers have priority in order they appear on the screen For example i...

Page 28: ...UTC or the specific time zone of the user This trigger is useful if the user will not have access to the Slam Stick for an extended period of time before a recording is needed This trigger is also us...

Page 29: ...the trigger Note that this is not a concern for Slam Stick S uses a piezoresistive accelerometer customers But if the user would prefer to use the piezoelectric accelerometer as the trigger you will...

Page 30: ...se temperature and pressure data are required for acceleration measurements to be calibrated By removing the checkbox from a channel this deactivates that channel on the Slam Stick and no data will be...

Page 31: ...up a trigger or view device information Select the device you wish to adjust the calibration for click OK and enter the configuration window as shown below 3 Click the Create User Calibration button a...

Page 32: ...12 Figure 12 The calibration editing window enables the user to edit the calibration coefficients for every sub channel on the Slam Stick data logger 7 The coefficients window should display the coef...

Page 33: ...ynomial coefficients in the same manner as the X and Y coefficients and click Apply to apply the correct coefficients This same process can be repeated for the piezoelectric accelerometer but this acc...

Page 34: ...pdate the driver It may take as much as one minute but the LED will then turn red and a Silicon Labs CDC Serial Port should show up in your control panel Unplug the Slam Stick once this occurs Once th...

Page 35: ...and vibration measurements for initial testing Film Television Stunt work for science programs All Slam Sticks are rated to operate between 20 C and 60 C Operation outside of this temperature range is...

Page 36: ...hese two methods of mounting are highly recommended and encouraged other mounting options such as magnetic mounting are also acceptable An incorrect mounting configuration could result in erroneous da...

Page 37: ...actice to use a washer If you have a plastic Slam Stick X or Slam Stick C the use of a washer is very important especially if you are using metal bolts The recommended mounting torque is 70 in oz for...

Page 38: ...t these coefficients for already recorded data Mide will also update the firmware on the device if there is an update available to reflect any improvements or bug fixes The calibrated device will be s...

Page 39: ...ow it to wait for the trigger or hold down button to skip to recording Rapid blinking Green Device is recording battery level is above 75 Allow it to continue recording or press button to end recordin...

Page 40: ...to download online here There are several how to videos that quickly go through some data viewing and analysis functionality of the software on the website Figure 14 Video 2 of Mid s how to video seri...

Page 41: ...OTE The software will be faster if loading files copied onto the computer and not opened directly from the device The viewing window and File drop down menu is shown in Figure 16 Figure 16 Opening an...

Page 42: ...s were less dense and or less severe than in actuality The Buffer Maximum and Minimum display can help visualize how the maximum and minimum acceleration levels are changing with time This can be espe...

Page 43: ...t are for the amplitude range The center button zooms to fit for that axis and there are keyboard shortcuts for this as well Alt 0 will zoom to fit in the y axis CTRL 0 will zoom to fit in the x axis...

Page 44: ...f view options are accessible via the View menu Preferences There are a number of user preferences which can be set in the Preferences window accessible under the Edit menu Many of these options are s...

Page 45: ...more information Drawing Options The user can opt between having one plot tab per sensor per channel or per sensor type There are also some numerical variables for controlling how many samples are pl...

Page 46: ...seful tab in this window is the channel info tab which has max min values for each channel and when they occurred The sample rate is also shown along with the sensor part number Figure 20 The recordin...

Page 47: ...the signal The user can either remove the mean across the entire recording or remove a rolling mean the time interval is editable under the preferences tab or disable mean removal to see the raw signa...

Page 48: ...r degree C Disabling this temperature dependent calibration is useful for reducing computation time especially when your recording is within a couple degrees of room temperature Display Warnings Data...

Page 49: ...disabled to expedite analysis time Figure 23 The analysis window is very similar for rendering plots FFTs PSDs and spectrograms this is accessible under the File Render drop down menu Render Plots Thi...

Page 50: ...waves and we use Fourier analysis or spectrum analysis to deconstruct a signal into its individual sine wave components The result is acceleration vibration amplitude as a function of frequency which...

Page 51: ...s is that this amplitude value is then normalized to the frequency bin width to get units of g2 Hz By normalizing the result we reduce the dependency on the number of samples in the original acquisiti...

Page 52: ...window the FFT is applied to the result and the PSD is taken A windowed PSD uses less computational power and memory and results in cleaner looking data because it is an average of data sets Note the...

Page 53: ...rmat One of the how to videos quickly gores through some examples of exporting data with the software on the website Figure 28 Video 4 of Mid s how to video series goes through some examples on export...

Page 54: ...selecting what file type the range if you d like column headers and the time format you wish When exporting to MATLAB the array will likely be the transpose of what you may be used to this is done for...

Page 55: ...ny recording files Figure 31 The tools allow the user to perform batch exports conversions and file splitting The dialog for all of these tools are very similar as shown in Figure 32 Each require the...

Page 56: ...ty raw2mat discussed in the Command Line Executables for Converting IDE Files section The user can perform batch exports of IDE files to MAT but the data will be in its raw 16 bit integer form Support...

Page 57: ...costs over 2 000 for a commercial license only 150 for a home license If cost is a concern Python offers an excellent alternative because it is open source and free Their SciPy library offers a colle...

Page 58: ...e utility completed the conversion of a recording file with nearly 4 million data points in about 10 seconds When loaded into MATLAB you ll see a large number of variables as shown below These arrays...

Page 59: ...or data This command line utility has the same functionality built into the Slam Stick Lab under the tools menu Calibrated Data Export Utility This utility is not as time efficient as the raw2mat util...

Page 60: ...rmation shown in the legend in the Slam Stick Lab main plot window It took 5 times longer 50 seconds to generate the calibrated CSV files of that vibration recording Three separate files are generated...

Page 61: ...storage capacity of the Slam Stick products can generate very large IDE files potentially large enough to adversely affect the performance of Slam Stick Lab and even MATLAB and Python scripts Mid deve...

Page 62: ...is shifted back overlapping the end of the previous file The time of the first accelerometer sample will be correct relative to the last accelerometer sample MATLAB Example Functions Mid provides som...

Page 63: ...er through how all this is being done SSL_Converter This function uses the command line utility raw2mat to take an IDE file and convert it to MAT then calls the SSL_Analyzer function to apply calibrat...

Page 64: ...s incredibly useful and he has a lot of great content on his blog detailing how to use the package Some of the functions embedded in this free package are only available to paying customers of MATLAB...

Page 65: ...User Manual Slam Stick User Manual Version No 2 0 65...

Page 66: ...Mid has had good luck with the process outlined in this online video Load_Plot_RMS_FFT_Spectrogram Mid provides an example Python script named Load_Plot_RMS_FFT_Spectrogram py that can be run from the...

Page 67: ...l Version No 2 0 67 Figure 33 An example python script to load a CSV plot data compute moving RMS compute a FFT and compute a spectrogram The script can be run from the command line as shown and it wi...

Page 68: ...User Manual Slam Stick User Manual Version No 2 0 68 The plots generated from this script analyzing the car engine data are shown below...

Page 69: ...wnloaded from his blog It reads in a CSV file that has just two columns time and the data of interest Use that example py python script to see how to take data from a CSV file with multiple sensor sub...

Page 70: ...strate how an IDE file can be converted to XML for the more advanced user looking to directly load data in a recording file The scripts are well documented but contact Mid with any specific questions...

Page 71: ...le is Corrupted or Does Not Display Data 0 KB file The Slam Stick may have suddenly ran out of power and therefore did not close out the file properly This can happen rarely due to battery dips but ca...

Page 72: ...vice information Product Support For technical support repair and returns the best way to contact Mid is through our web contact page http www mide com pages contact and select Data Logging as the are...

Page 73: ...and durability are paramount and semi permanent mounting for instance bolting or epoxy adhesive is available What is the MEMS DC accelerometer option and why do I need it The MEMS accelerometer or DC...

Page 74: ...chargers that have a smart auto shut off feature once the device is charged You ll need a product that doesn t have this feature such as the V15 4 000 battery or V44 12 000 mAh battery from Voltaic W...

Page 75: ...s own natural frequency during these events Some customers use mounting fixtures which aren t stiff enough which can amplify shock vibration events Lastly you can continue using the unit you have in t...

Page 76: ...quick overview of different accelerometer types and provides some more information on integrating acceleration data What are the noise characteristics of the embedded accelerometers See the Component...

Page 77: ...ery component axis that is a result of the on board programmable gate array doing the temperature compensation It s a characteristic of this accelerometer Figure 36 The piezoelectric accelerometer has...

Page 78: ...f our technology and know how is centered on data acquisition and analysis So in the future our product line will evolve to accommodate external sensors and more embedded sensor options We also recogn...

Page 79: ...selection to analysis Many links are provided to supplemental information and suppliers to keep the eBook as quick hitting and brief as possible Links are not limited to Mid s partners links to Slam...

Reviews: