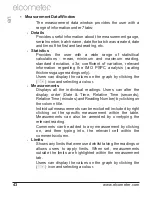
Measurement Data Window
The measurement data window provides the user with a
range of information under 7 tabs:
Details
Provides useful information about the measurement gauge,
serial number, batch name, date the batch was created, date
and time of the first and last reading, etc.
Statistics
Provides the user with a wide range of statisitical
calculations - mean, minimum and maximum reading,
standard deviation, ±3
σ, coefficient of variation, relevant
information regarding the IMO PSPC analysis (coating
thickness gauge readings only).
Users can display the values on the graph by clicking the
( ) icon and selecting a colour.
Measurements
Displays all the individual readings. Users can alter the
display order (Date & Time, Relative Time (seconds),
Relative Time (minutes) and Reading Number) by clicking on
the column title.
Individual measurements can be excluded/ included by right
clicking on the specific measurement within the table.
Measurements can also be amended by overtyping the
relevant reading.
Comments can be added to any measurement by clicking
on, and then typing into, the relevant cell within the
comments column
.
Limits
Shows any limits that were used whilst taking the readings or
allows users to apply limits. When set, measurements
outside the limits are highlighted within the measurement
tab.
Users can display the values on the graph by clicking the
( ) icon and selecting a colour.
R
en
www.elcometer.com
43


