


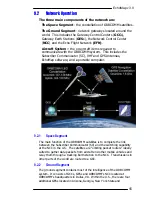


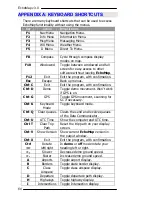
EchoMap v3.0
46
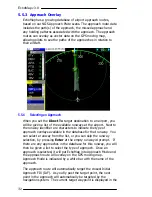
7.4.2
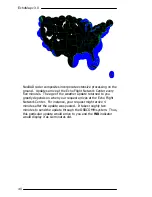
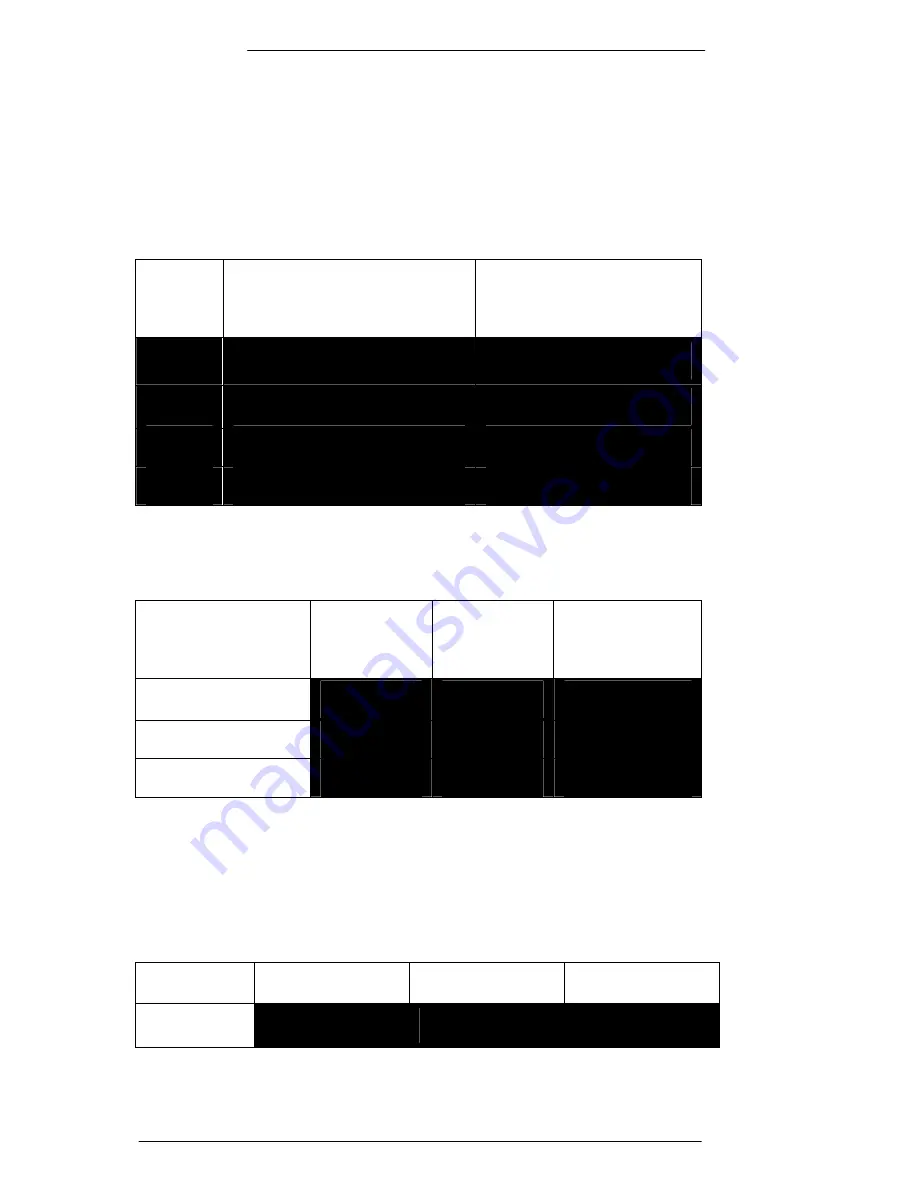
Interpreting Graphical Ceiling / Visibility Reports
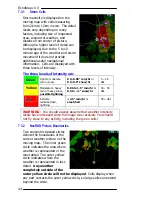
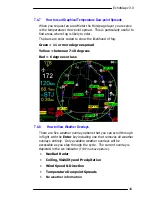
A graphical Metar report has three pages of information. The first
page of information shows Ceiling, Visibility and Precipitation for
each reporting airport. A vertical bar displays ceiling status and a
horizontal bar visibility status, forming an L-shape. The color of
the bar indicates the status.
Statu
s
Ceiling
Visibility
VFR Greater than 3,000 ft Greater than 5 Nm
MVFR
1,000 to 3,000 ft
3 to 5 Nm
IFR
500 to 1,000 ft
Less than 3 NM
LIFR
Less than 500 ft
Less than 1 Nm
7.4.3
How to Read Precipitation Levels
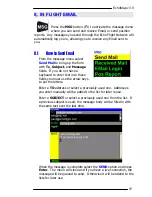
Inside the
L
-shaped Ceiling/Visibility bars may be letters indicating
precipitation. If there is no letter, then this data isn’t reported.
Precipitation
Light
Moderat
e
Heavy
Rain
RA-
RA+
RA++
Snow
SN-
SN+
SN++
None
NP
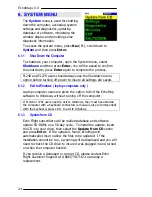
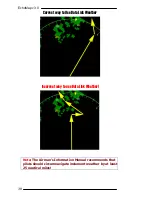
7.4.4
Interpreting Metar Age
It is important to remember that METAR information from multiple
airports is not all from the same time period. The times of the
individual Metar reports is shown by color-coding the associated
airport identifier. Some airports don’t supply Metar data and have
normal coloring.
Identifier
0-30 minutes
30-60 minutes
60+ minutes
PDX
PDX
PDX
PDX
Summary of Contents for EchoMap 3.0
Page 27: ...EchoMap v3 0 27...