21
XSTORAGE HOME 3P USER MANUAL
MN700011EN December 2020 www.eaton.com
6.4 Charts menu
The charts menu enables the end-users to access the data stored in the local memory and user interface. The information and
settings available from the menu are also relevant for maintenance and diagnostics. Due to continuous improvement it is possible
that changes will be implemented in the future.
The following data are recorded by the built-in local user interface:
- Daily time-related data of the photovoltaic installation, the battery, the grid, and the load powers.
- Weekly calculation, with daily partition, of the energy produced by the photovoltaic installation, the power sent to the grid,
the power drawn from the grid and the load.
- Yearly calculation, with monthly partition, of the energy produced by the photovoltaic installation, the energy power injected
to the grid, the energy power consumed from the grid and the load.
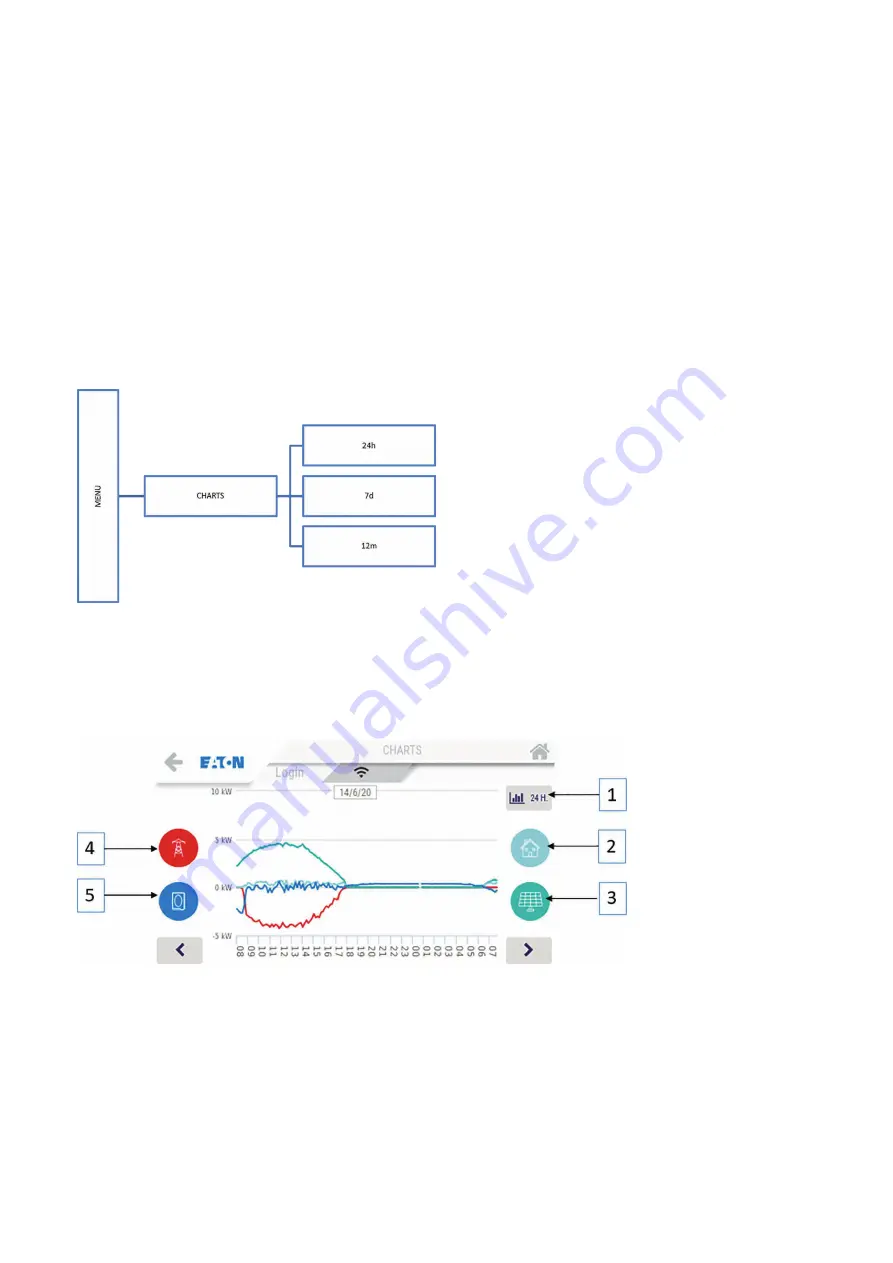
Figure 15. The structure of the charts menu
Scroll down using the key associated with the selection of the type of graphics to access the different graphics.
6.4.1 “24h” chart
Figure 16. Day chart from the xStorage Home 3P display
The 24 hours chart available from the xStorage Home 3P display is composed by:
1. “CHART SELECTION” key.
Press this key to select the different charts (24 hours
→
7 days
→
12 months).
2. “NON-CRITICAL LOADS” key.
Press this key to enable / disable the display of the associated value and trace on
the graphics area.
3. “PV” key.
Press this key to enable / disable the display of the associated value and trace on the graphics area.
4. “GRID” key.
Press this key to enable / disable the display of the associated value and trace on the graphics area.
5. “BATTERY” key.
Press this key to enable / disable the display of the associated value and trace on the graphics
area.


