15
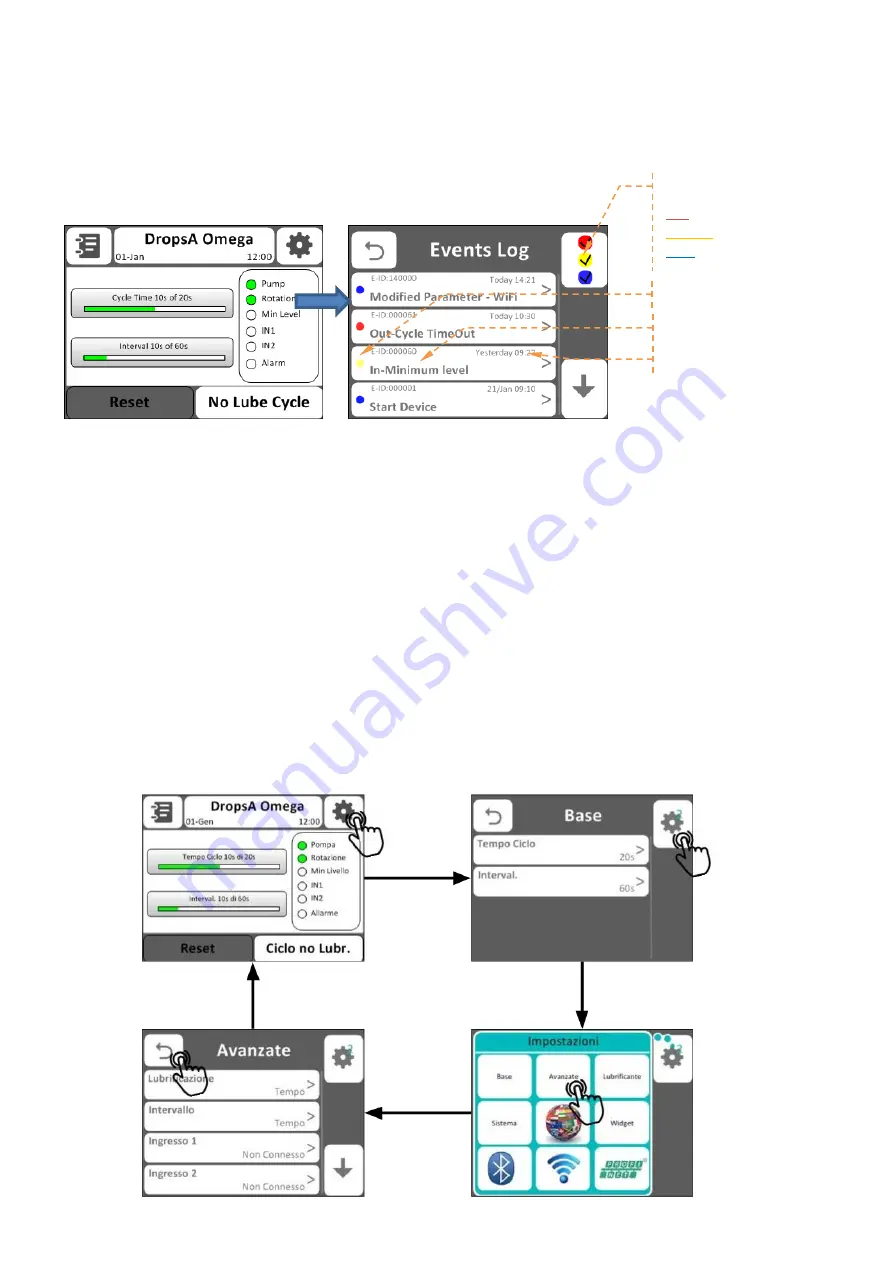
9.3 DESCRIPTION OF THE “EVENTS LOG” DISPLAY
Clicking on the button at the top left, you can view the “events log” menu. This menu lets you view all the operations carried
out on the pump, also allowing you to filter the events by alarm.
For example, clicking on the red dot, only the events connected with alarms, the yellow includes both events related to
alarms and those related to warnings such as the minimum level signal and filtering the blue colour, all of the operations that
have been carried out will be displayed.
9.4 PROGRAMMING THE PUMP
The following section describes: the main graphic components of the interface, navigation between the settings menus and it
contains a detailed explanation of every parameter and the possible values that they can assume.
The pump can be managed with 2 MAIN MENU:
-
BASIC MENU
-
ADVANCED MENU
9.4.1.
NAVIGATION BETWEEN THE VARIOUS MENUS
To access the menus click on the gear in the upper right corner, from the initial screen, in this way you enter directly into the
basic menu. Press on the gear in the upper right corner to display the menu selection pop-up. Press one of the nine buttons
to use the desired menu.
To return to the home screen and exit the menu, press the arrow in the upper left corner.
Below is shown the common navigation modes in the Basic and Advanced setting menus.
FILTERS
RED
: Alarms
YELLOW
: Warnings
BLUE
: Information
Type of Log displayed
Event date
Event name


