108
LEADING IN PRODUCTION EFFICIENCY
Operating Manual
© Dürr Systems AG
ED3K_Operating_Manual_Rev02LD_03Lug2020_EN. docx
Rev.02 – 03.07.2020
While filling out the table, write in the column T [C°] the temperature shown on the screen,
measured by the Coriolis flow meters.
While spraying at different temperatures, the calculated values of the output are corrected adding
a ∆ term obtained multip
lying the difference in temperature between the value in the table and the
actual temperature for the coefficient K. ∆ = (Ttable
–Tactual)*K
In the table above for instance, in the recipe 1, with a requested set point of 170 ml/min interpolating
the data the calculated output to the regulator is 31.8% at 20.5 °C.
Spraying at 25°C ∆ = ( 20.5
-25 )*0.8 = - 3.6 and the corrected output 31.8 - 3.6 = 28.2 [%].
The value of K, has to be determined experimentally; generally the values of K are positive: at a
defined flow setup the greater is the temperature, the lower is the output regulator value needed.
Start with a zero value of K and rise it gradually to compensate the temperature effect on the values
previously saved in the table.
Write zero in the temperature T and K columns if the temperature compensation is not needed.
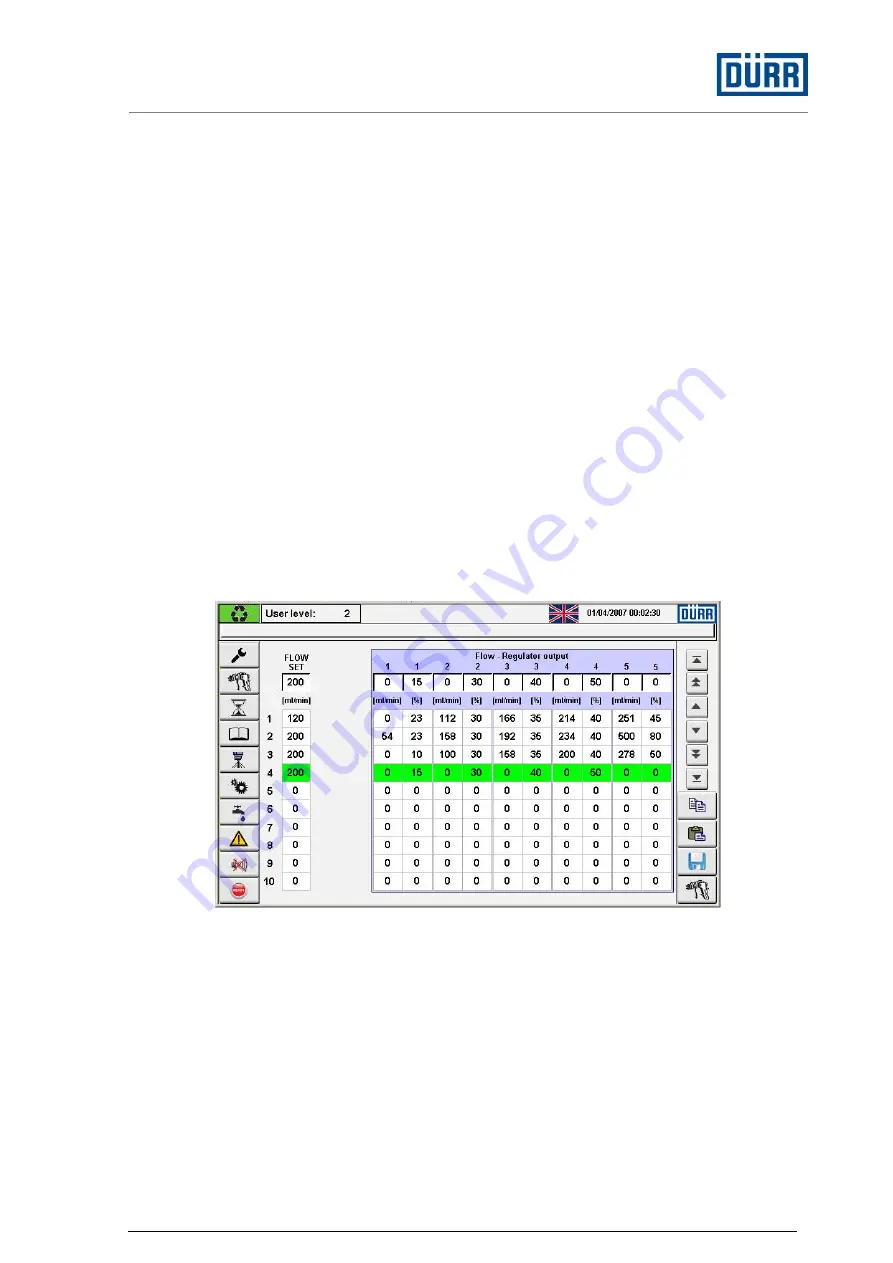
If the system is equipped with an EcoCleaner M the table can be filled with an automatic quick
procedure.
Place the gun already loaded in the EcoCleaner M, login with user level two or higher.
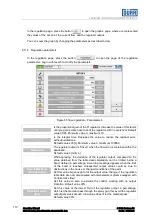
Figure 62 regulation data table automatic fill out procedure

