ENGLISH
.
Cod. 9828093300 00 - Vers. 04/2019 - 37
Chart display
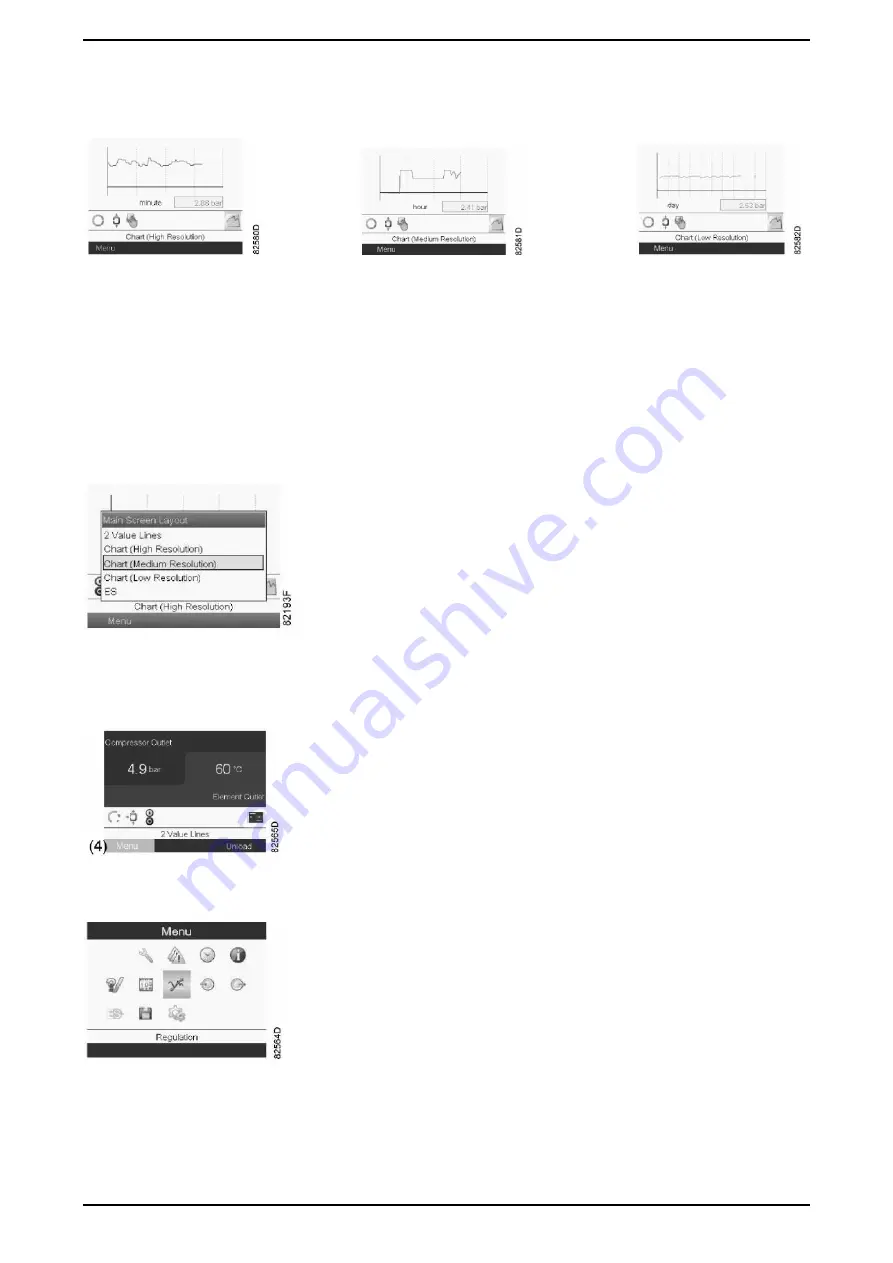
Instead of viewing the values, it is possible to view the chart of one of the input signals (see Input Menu section) based on time.
High resolution
Medium resolution
Low resolution
When Chart (High Resolution) is selected, the chart shows the variations of the selected input (in this case pressure) per minute. The
immediate value is also displayed. The screen shows the values of the last 4 minutes.
The switching button (icon) to select other screens assumes the appearance of a small chart and is highlighted (active).
When Chart (Medium Resolution) is selected, the chart shows the variations of the selected input per hour. The screen shows the values of
the last 4 hours.
When Chart (Low Resolution) is selected, the chart shows the variations of the selected input per day. The screen shows the variations
over the last 10 days.
Main screen selection
To move between the various layouts of the screen, select the rightmost icon in the row of command icons (see value lines display icon or
chart display icon in the Icons used section) and press the Enter button. A screen will appear similar to the one shown below:
Select the desired icon and press the Enter key. See also Input Menu section.
Menu recall
Description: when the controller is powered, the main screen is automatically displayed (see Main Screen section):
To switch to the Menu screen, select the Menu button (4) using the scroll keys.
Press the Enter key to select the menu. The following screen appears:
A series of icons are shown on the screen. Each icon represents a menu item. By default, the pressure settings icon (regulation) is
selected. The status bar shows the name of the menu corresponding to the selected icon. Use the scroll keys to select an icon. Press the
Escape key to return to the main screen.
Alarm display


