Cambridge Sensotec Rapidox 1100E Oxygen Analyser Instruction Manual
Version 3.8
28
Last printed 29/08/2012 16:01:00
file automatically at regular intervals and the format is compatible with modern
spreadsheet programmes such as MS-Excel. A live-time graphing facility is also
included which has many powerful features. Note that the data logging facility
will only function if the analyser is in NORMAL run mode, and will be suspended
automatically during start up or if the set up menu has been activated via the front
panel keypad.
8.2
Setting up the Data Logger
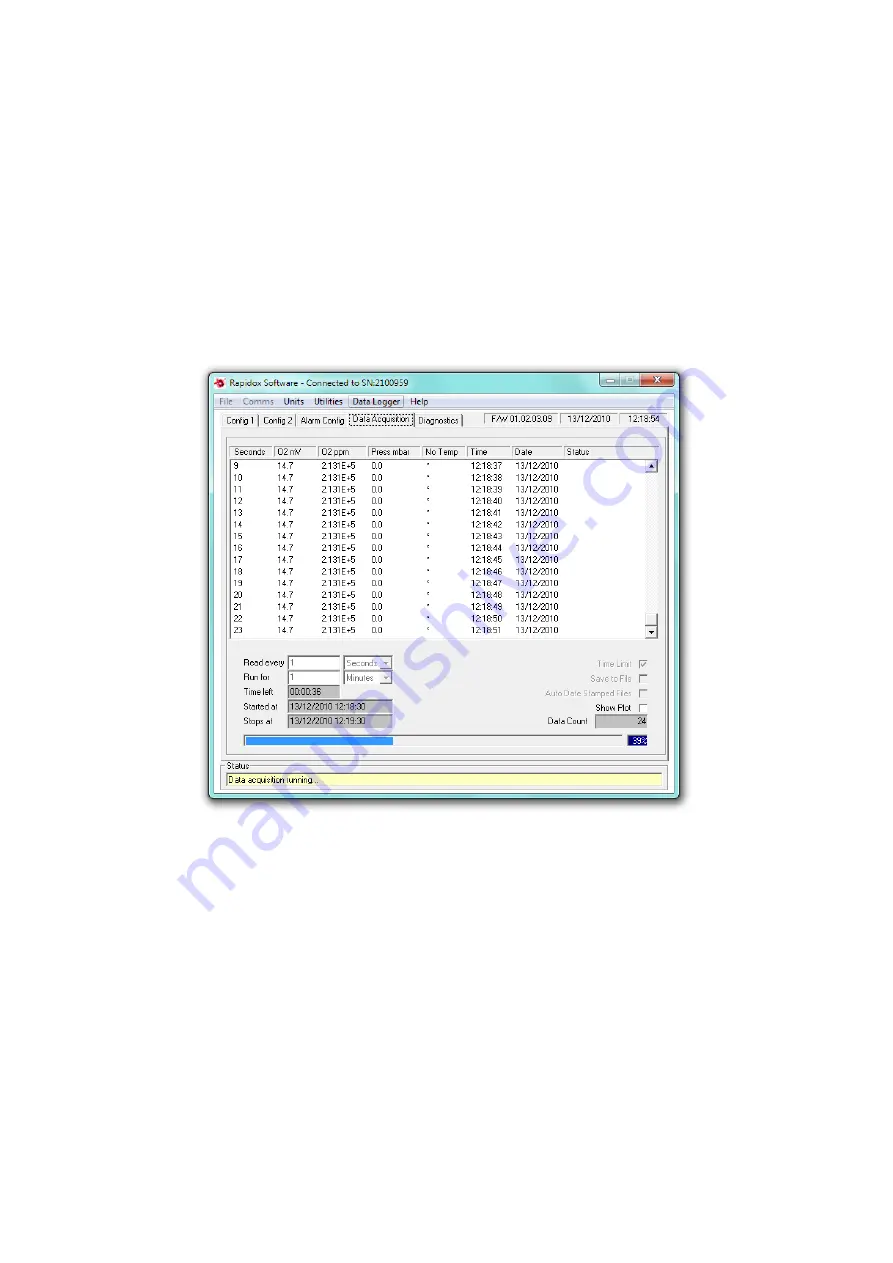
Click on the tab labelled ‘Data Acquisition’ to display the following page:
Figure 16: Data Logging page
During logging, data from the analyser is shown in the central area of this page.
The data is displayed in the following columns: time (in seconds), the raw signal
from the sensor (in mV), the oxygen value (in ppm scientific notation), pressure in
mbar, the time (in regional format), the date (in regional format), and status
(displaying the word ‘ALMx’ if any alarms are activated).
To start data logging select the frequency of measurement by entering a time and
selecting a unit from the drop down list next to the ‘Read every’ label. For
example if you wish to log data once every minute, type ‘1’ in the box and select
‘Mins’ from the drop down menu.
You can open the NOTES window at any time by selecting ‘Notes’ from the ‘Data
Logger’ drop down menu. A small text box appears in which you can type a text
Summary of Contents for SENSOTEC Rapidox 1100E
Page 46: ......


