9.6
Boreal Laser Inc.
GasFinderFCr Operation Manual — Appendices
July 17th 2017
Explanation of R
2
(continued)
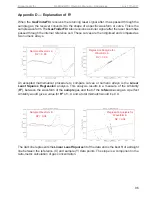
A typical plot of
concentration
versus
R
2
will give the following graph:
With lower levels of sample gas, the
R
2
s
decrease, and equal zero when there is
no gas present. As the signal from the
gas becomes stronger, the effect of noise,
both electronic and optical, is reduced
and the
R
2
s will increase (i.e., the signal
to noise ratio will increase). The general
shape of the plot is the same for all gases;
however, the x-axis values will depend on
the sensitivity of the instrument to the gas
species being observed.
Use of R
2
The point at which the bend or ‘knee’ of the curve occurs in the plot of R
2
/ ppmm
can be
used to determine the sensitivity of the instrument to the gas concentration measurement.
This varies with the instrument and the type of gas but an R
2
of 0.85 is generally agreed to
be the point at which the readings can be considered valid. Below this the readings should
be treated with suspicion.
R2
ppmm
Summary of Contents for GasFinder FC
Page 50: ...7 8 Boreal Laser Inc GasFinderFCr Operation Manual Troubleshooting July 17th 2017...
Page 56: ...9 2 Boreal Laser Inc GasFinderFCr Operation Manual Appendices July 17th 2017...
Page 71: ......
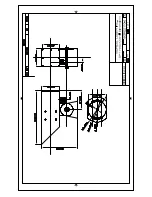
Page 73: ...BOREAL LASER INC MC Instrument Overall Dimensions JB0125MC A 1 of 1 NTS A Dim mm...
Page 75: ......
Page 77: ......
Page 79: ......
Page 81: ......
Page 83: ......
Page 85: ......
Page 87: ......


